Objective
Welcome to the Conduct a Baseline Heat Risk Assessment module! This module outlines your first steps for understanding the local impacts of extreme heat. It will help you understand existing conditions to inform planning, advocacy, and investment around heat resilience, and to track progress.
Essential Actions, Outputs, and Outcomes from this Module
Actions
-
Identify temperature trends in your jurisdiction, such as future projected temperatures (e.g., in 20 or 50 years), the heat season and its characteristics, and types of heat waves, as well as other local climate issues (hurricanes, droughts, wildfires) that may intersect with heat impacts.
-
If possible, identify reliable local spatial temperature data (ideally, daytime and nighttime air temperatures; alternatively, estimated land surface temperature) and map out hotspots.
-
Identify local stakeholders with heat-related knowledge, resources, or existing relationships/shared trust with heat-affected communities.
Outputs
-
An analysis of temperature trends and characteristics of heat in your jurisdiction. If possible, a map showing both temperature and population distribution.
-
A list of relevant partners to help co-develop heat-related assessments, planning, and projects.
Outcomes
-
Available heat-related data is identified.
-
Extreme heat impacts on your jurisdiction’s residents are defined.
-
Actions already being taken to address heat impacts in your jurisdiction, and areas and populations benefiting, are identified.
-
Key partners contributing to and involved in these actions are identified.
Overview
The Essential Actions, Outputs, and Outcomes include the core elements of the more comprehensive approach described throughout the rest of the module. We know that time, resources, and capacity can limit the breadth and depth of interventions you undertake. Simply beginning to explore these modules and consider what solutions are appropriate for your context is a critical step toward building your jurisdiction’s heat resilience. At any point, reach out to Arsht-Rock using the contact form at the bottom of the page with questions and comments.
Key factors
Extreme heat exposure, magnitude, and frequency depend on a wide variety of factors including:
- Physical attributes of the area. For example, city density, geomorphology of the region, water resources, wind patterns, and building type, layout and orientation.
- Local and regional climate. The area may face compounding hazards including storms, drought, flood, and wildfire that can exacerbate heat-related risks.
- Existing green and blue infrastructure. Some areas of a city may be more vulnerable to heat waves because they do not have many natural systems that provide cooling effects.
- Albedo (i.e., solar reflectance) of infrastructure. Some materials in roads, roofs, and other surfaces have a low albedo (and absorb more heat) than others, which affects local temperatures.
- Usage of mechanical cooling and vehicles. Waste heat from vehicles and air conditioners can worsen the urban heat island effect.
In addition, when undertaking a baseline risk assessment, consider:
- Community capacity to partner and current interest in the topic of extreme heat.
- Government structure and policy landscape. How your local government is organized (e.g., the remits of each agency), where the government has legal authority to act, and any existing local, regional or national measures related to heat and/or climate change.
- Data availability, prior related initiatives, and existing partnerships with potential stakeholders.
- Heat-related vulnerability due to physical, social/cultural, or economic factors. See Identify Heat-Related Vulnerabilities and Impacts to explore this topic further.
Resources
Plan Integration for Resilience Scorecard for Heat
- United States
For an example of a methodology that can be used to analyze how heat-related policies are integrated across existing city plans, see Plan Integration for Resilience Scorecard for Heat, produced by Keith et al. (2022).
Beating the Heat: A Sustainable Cooling Handbook for Cities
- United States
For more information on objectives and key factors in developing a baseline assessment, see pages 59-62 of the Beating the Heat handbook developed by the Cool Coalition, the UN Environment Programme, RMI, Global Covenant of Mayors for Climate & Energy, Mission Innovation and the Clean Cooling Collaborative.
Video
Analyzing the Policy Landscape with PIRS™ for Heat
Watch to learn how to analyze whether your existing policies exacerbate or reduce extreme heat from Dr. Ladd Keith, Assistant Professor at University of Arizona, and Dr. Sara Meerow, Associate Professor at Arizona State University

Analyzing temperatures in your jurisdiction
There are many ways of analyzing current and future temperature and temperature distribution, with varying cost, technical complexity, and data requirements. Common approaches include:
- Calculating how many days each year your community experiences daytime temperatures that go over a maximum threshold. This can build a case for action and investment.
- Analyzing the urban heat island by comparing the temperatures in nearby non-urban areas with those within your jurisdiction. This can reveal to what extent the built environment and other factors influence heat exposure in your city.
- Analyzing temperature distribution in your community to assess which neighborhoods are hotter or cooler. This can reveal where heat exposure might be most intense and begin to guide heat resilience investments.
To understand heat exposure and vulnerability more deeply and identify priorities for heat resilience investments, you can:
- Overlay heat maps with population or heat vulnerability data (see Identify Heat-Related Vulnerabilities and Impacts).
- Assess public and stakeholder awareness (see Assess Heat Risk Awareness) and other impacts of heat including harm to the economy, infrastructure, and people’s health.
These analyses may have already been conducted for your jurisdiction by researchers or non-governmental organizations. If not, consider partnering with institutions or organizations that have the relevant technical capacity or local knowledge to conduct or review the analysis. You can also take a lower-investment approach initially and follow later with more data-intensive analysis when resources and capacity become available.
Resources
Urban Heat Mapping Framework
- United States
For a practitioner-oriented overview of heat mapping approaches, technologies, and considerations, see Arsht-Rock’s Urban Heat Mapping Framework.
Measuring Heat Islands
- United States
For an overview of how to measure urban heat island, see the US Environmental Protection Agency’s Measuring Heat Islands webpage.
eThekwini Climate Impact Atlas
- South Africa
For a storymap on heat stress in eThekwini (South Africa), see the Climate Impact Atlas, commissioned by C40 Cities with eThekwini, and developed by Climate Adaptation Services.
Lessons From Heat Mapping In Two Tropical Cities
- Global
For a summary of how Freetown (Sierra Leone) and Rio de Janeiro (Brazil) used participatory mapping methods involving residents to map city temperatures, see Lessons From Heat Mapping in Two Tropical Cities from the US National Oceanic and Atmospheric Administration.
Boston’s Heat Resilience Solutions Plan
- United States
For an example of projected hot days and city-level maps of daytime and nighttime temperature see the City of Boston’s (United States) plan, Heat Resilience Solutions.
Identifying data sources
If heat-related analyses of your jurisdiction don’t exist or are insufficient, you may need to locate or commission new heat and health-related datasets. While basic temperature data is often publicly available, higher resolution data and data that is more helpful for decision-making are often more expensive or difficult to locate.
For example, free or low-cost land surface temperature datasets (a measure of how hot the surface of Earth is) are easier to locate but do not provide as accurate a measure of the temperatures people feel, making them less helpful for decision-makers. Air temperature, a more accurate measure of felt temperatures (and therefore of potential health impacts), is more difficult to locate.
Key data types include:
- Temperature (daytime and nighttime, land surface or air temperature)
- Humidity (relative humidity or dew point)
- Health (heat-induced or all-cause hospital visits, heat illness and deaths)
- Demographics (population distribution, age, income)
- Land cover (e.g., trees, soil, concrete, buildings)
- Albedo
Resources
Think Hazard!
- Global
For regional data on heat risk around the world, search on the Global Facility for Disaster Risk Reduction’s Think Hazard! website. The tool models the likelihood of prolonged exposure to extreme heat within a region in the next five years and explains projected temperature rise.
Climate Impact Map
- United States
To visualize temperature change around the world in the next twenty years, by mid-century, and by end of century across representative concentration pathway (RCP) scenarios, see the Climate Impact Map. Developed by the Climate Impact Lab, the map shows scenarios for RCPs, which project greenhouse gas emissions. The tool also allows you to project energy and mortality costs in GDP terms.
Mapped: How every part of the world has warmed—and could continue to warm
- United States
For a more fine-grained global map of projected temperature rise, see CarbonBrief’s analysis Mapped: How every part of the world has warmed – and could continue to warm.
Guidance on Measuring, Modelling, and Monitoring the Canopy Urban Heat Island (CL-UHI)
- Global
For a technical overview of Canopy Urban Heat Island data collection methods, see Chapter 5 of the World Meteorological Organization’s Guidance on Measuring, Modelling, and Monitoring the Canopy Urban Heat Island (CL-UHI).
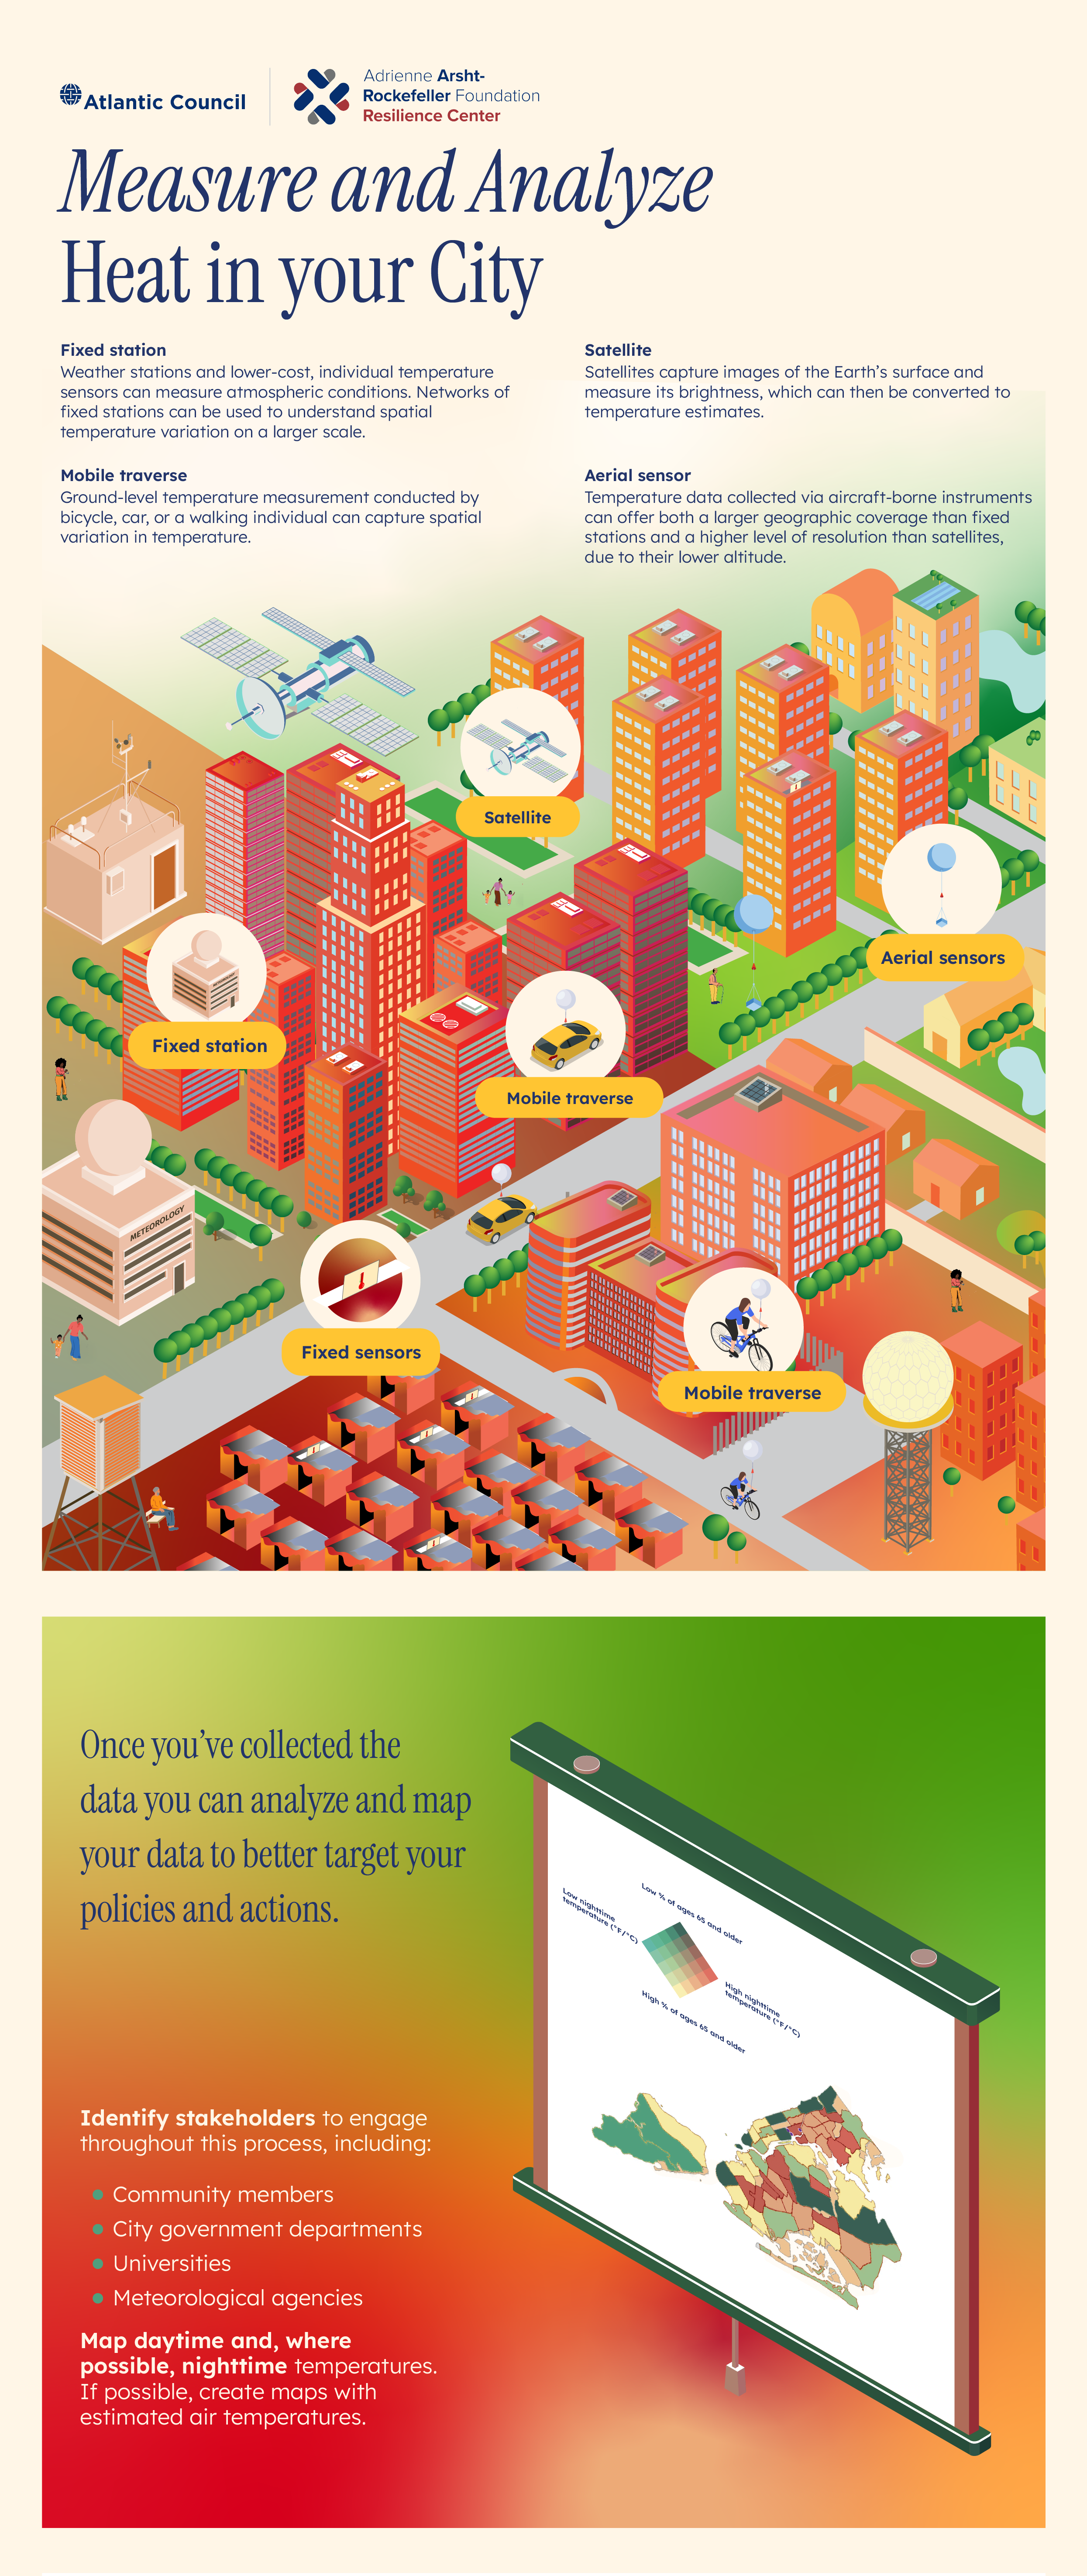
Infographic
Measure and Analyze Heat in your City
Click below to see common methods of measuring and mapping temperature.

Identifying your stakeholders
Extreme heat has impacts across many sectors and agencies’ responsibilities. Coordination is necessary to avoid a siloed approach to increasing heat resilience, as is developing processes for partners with diverse perspectives to weigh in and ensure holistic, inclusive strategies.
Stakeholder mapping is a first step to ensure that the process to develop heat resilience projects and strategies is inclusive and collaborative. By using this information and engaging with partners, you can center expertise from affected communities and organizations. Understanding your stakeholders also helps to identify which metrics are suited for measuring success and lays the groundwork for engaging those partners in gathering the relevant data.
Stakeholder mapping identifies the range and distribution of individuals and organizations that have an interest in or could influence your work as well as those that will be impacted by your work. Your mapping process may also document their needs, perspectives, and capacities. This helps inform decisions on who should be involved at various stages of the planning, implementation, and post-project timeline.
Without thorough stakeholder analysis and engagement, a project will not fully consider who should be consulted or invited to be a co-creating partner at each step of the process. This may result in a biased outcome that is not fully representative or does not achieve the necessary support for long-term success.
Resources
Participation Tools for the Pacific
- The Pacific
For an overview of stakeholder analysis approaches and terminology, see page 17 of Participation Tools for the Pacific, produced by the Asian Development Bank.
Starting the stakeholder mapping process
Stakeholder mapping approaches range from highly participatory to more top-down methods. Limiting the participants in your mapping process to your direct team or organization is a more top-down method while involving a larger set of stakeholders in brainstorming discussions or snowball mapping is a more participatory approach. To avoid too large a pool of stakeholders, set a clear scope for your mapping exercise that fits your objective, such as only including actors involved in community-level heat preparedness within your city.
Prioritize and categorize your stakeholders based on their relevance to your project and any emerging themes from the mapping exercise. Keep in mind whose voices are usually not heard and find ways to engage them. Finally, identify relationships between stakeholders and add context to your stakeholder map.
A non-exhaustive list of stakeholders you could engage includes:
- Communities: City residents, community-based organizations, and faith-based organizations.
- Public sector: Municipal agencies, and regional and national planning entities.
- Private sector: Media outlets, healthcare professionals, energy planners, technology providers, senior centers, schools and childcare providers, and real estate developers.
- Universities: Researchers at local or national institutions.
Not all stakeholders identified during your mapping process will necessarily be involved in your work. Throughout your project or planning process, return to the initial stakeholder map and assess which stakeholders should be engaged, and how and when they should be engaged.
Resources
Involving Stakeholders
- Europe
For an overview of stakeholder analysis methodologies, see the Involving Stakeholders page of the RESIN Learning Centre.
City Resilience Toolkit
- India
For a checklist of recommended stakeholders to engage, see pages 9-10 of the City Resilience Toolkit, produced by the Natural Resources Defense Council, the city of Ahmedabad, India, and the Climate and Development Knowledge Network, among other partners.
Extreme Heat Action Plan
- United States
For description of the process Miami-Dade County, Florida went through to engage stakeholders during the creation of its Extreme Heat Action Plan, see page 7 of the plan.
Heatwave Guide for Cities
- Global
For a more detailed list of heat-related stakeholders, see pages 24-27 of the Red Cross Red Crescent Climate Centre’ Heatwave Guide for Cities.
Streamlining your work with existing projects, policies, and processes
In parallel with the stakeholder mapping process, begin identifying the projects in your jurisdiction that relate to heat resilience and build early partnerships with these stakeholders. This could include early warning system development, regulatory changes, implementation projects such as urban tree planting, and awareness campaigns, among others. This can also include projects that are not explicitly focused on heat (e.g., social programs focused on homelessness or biodiversity initiatives) but have heat resilience co-benefits.
If there are “easy wins” such as integrating heat considerations into guidelines, regulations, or other planning processes, this can build momentum around the issue and lay the groundwork for larger scale measures in the future.
Congratulations! You’ve completed Conduct a Baseline Heat Risk Assessment.
Review the Essential Actions, Outputs, and Outcomes from this Module or proceed to the next module.

Get in touch with questions and feedback
Contact Owen Gow, Associate Director of Extreme Heat Initiatives at the Adrienne Arsht-Rockefeller Foundation Resilience Center.
Get additional support, ask questions, or make suggestions for improving the platform.

Download additional resources to support your work
Access supplemental materials to advance your work, including downloadable infographics and technical briefs on worker protection policies and urban heat mapping.
Continue to the next module
Continue to the next module, ‘Identify Heat-Related Vulnerabilities and Impacts’. Identify geographies and populations most at-risk to heat and consider how this may change in future scenarios.