Overview
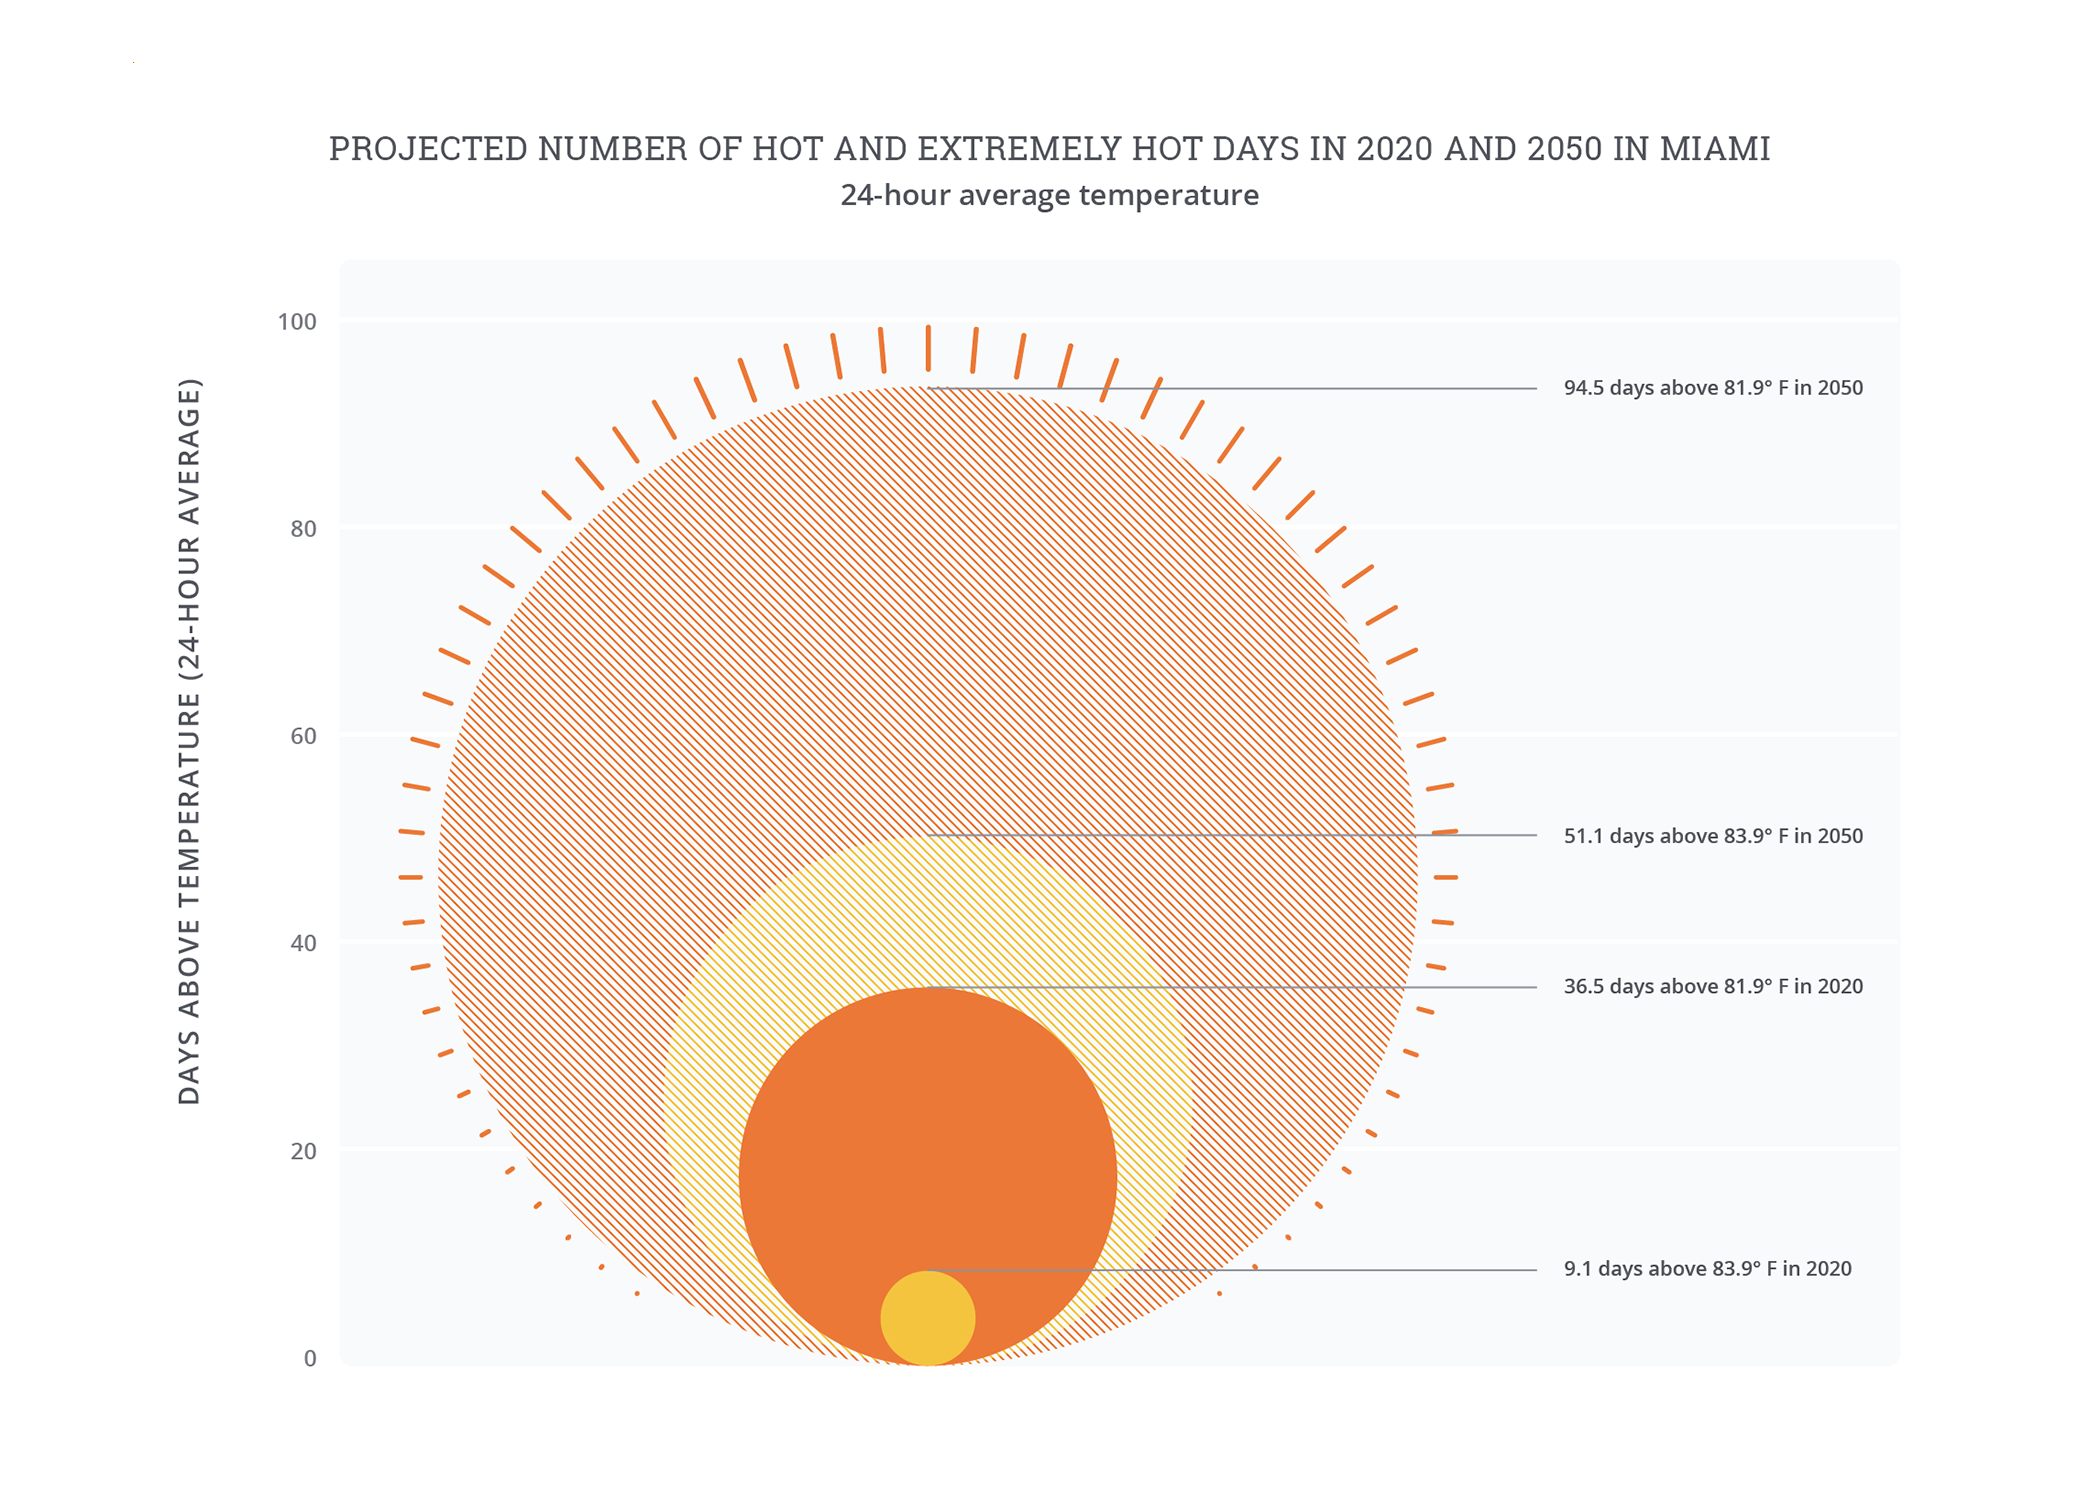
In an average year, the ten hottest days in Miami see temperatures average more than 28°C (83°F) over a twenty-four hour period. Without action to reduce emissions, by the 2050s more than fifty days may exceed this threshold every year.
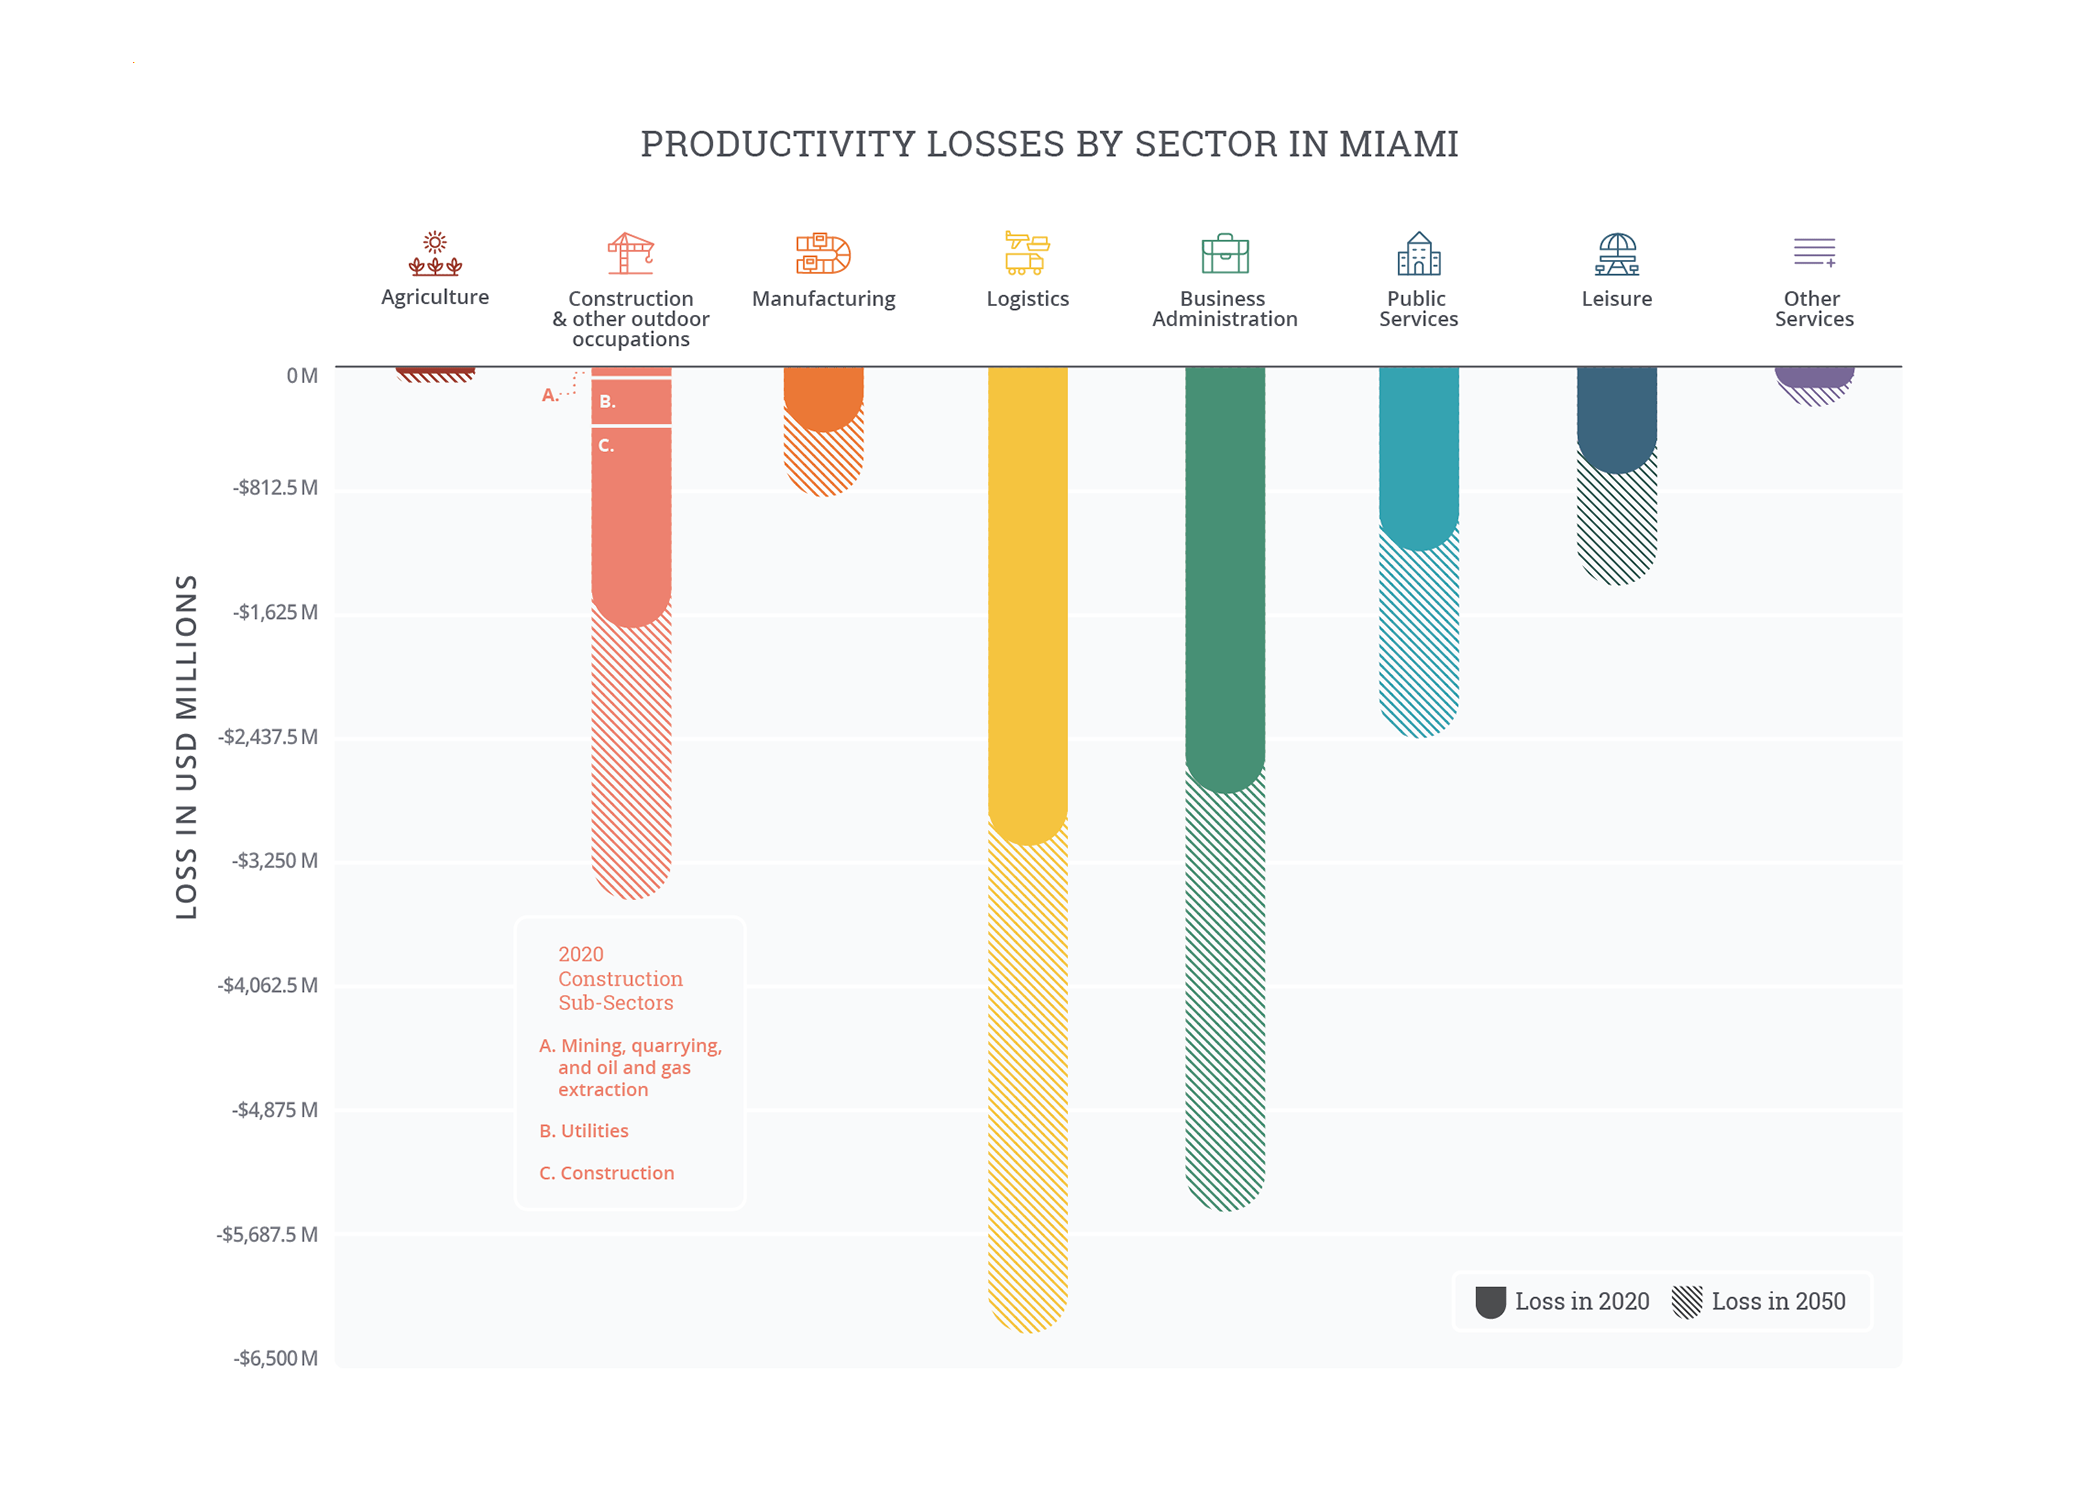
In Miami, high heat combines with humidity to reduce labor productivity, leading to losses of over USD 10 billion under current conditions—more than Miami-Dade County’s annual budget. By 2050, without action to reduce emissions or adapt to increased heat, losses could double to more than USD 20 billion.
Miami is pursuing ambitious resilience-building initiatives under the direction of its Chief Heat Officer—the first city in the world to appoint one—aimed at reducing heat in the city and protecting the most vulnerable. The data-driven and participatory approach to targeting efforts can be scaled to meet a challenge of this magnitude.
Impacts of heat
The number of extremely hot days in Miami is projected to increase fivefold by 2050. High heat, humidity, and direct sunlight, with little respite during the night, have compounding physiological impacts on residents and visitors. The ten hottest days in Miami in a typical year have average temperatures above 28°C (83°F), often remaining above 25°C (77°F) overnight with high humidity. By 2050 over fifty days a year—more than a month and a half every summer—may exceed what is currently a local “extreme” temperature. In built-up areas, the heat is exacerbated by urban heat island (UHI) “hotspots,” where the land surface temperature (LST) can be as much as 12°C (21°F) hotter on average in the summer compared to rural surroundings—a gap expected to rise to up to 15°C (27°F) hotter by 2050.
Miami’s hot and humid climate costs the city over USD 10 billion of output due to lost worker productivity in a typical year—higher than the entirety of Miami-Dade’s annual budget of USD 9 billion. Without action to reduce emissions or adapt to the rising temperatures, these heat- and humidity-related losses are projected to double to reach USD 20 billion annually by 2050. Growing losses reflect both increased temperatures resulting from climate change (labor productivity losses for outdoor workers could be as much as 20 percent in heat-exposed conditions) and conservative economic growth assumptions (41 percent in Miami between 2020 and 2050). If nonlabor costs were fully accounted for—for example, increases in hospital admissions, damage to infrastructure from high heat and humidity, and reduced tourist traffic—then the true costs could be higher still. Further indirect effects also mean the true cost of heat is even higher, as heat- and humidity-related labor productivity losses reduce wages and profits and consequently total demand, so sectors where workers are highly resilient to heat may still suffer indirect declines due to heat.
While every sector of Miami’s economy is affected by lost productivity, losses fall disproportionately in lower-paid sectors, such as wholesale trade and construction. Absolute losses are greatest in Miami’s most economically important sectors: for example, Miami’s finance and real estate sectors, which account for 25 percent of output and lose an estimated USD 1.6 billion, or 1.7 percent of their output, to heat in a typical year.
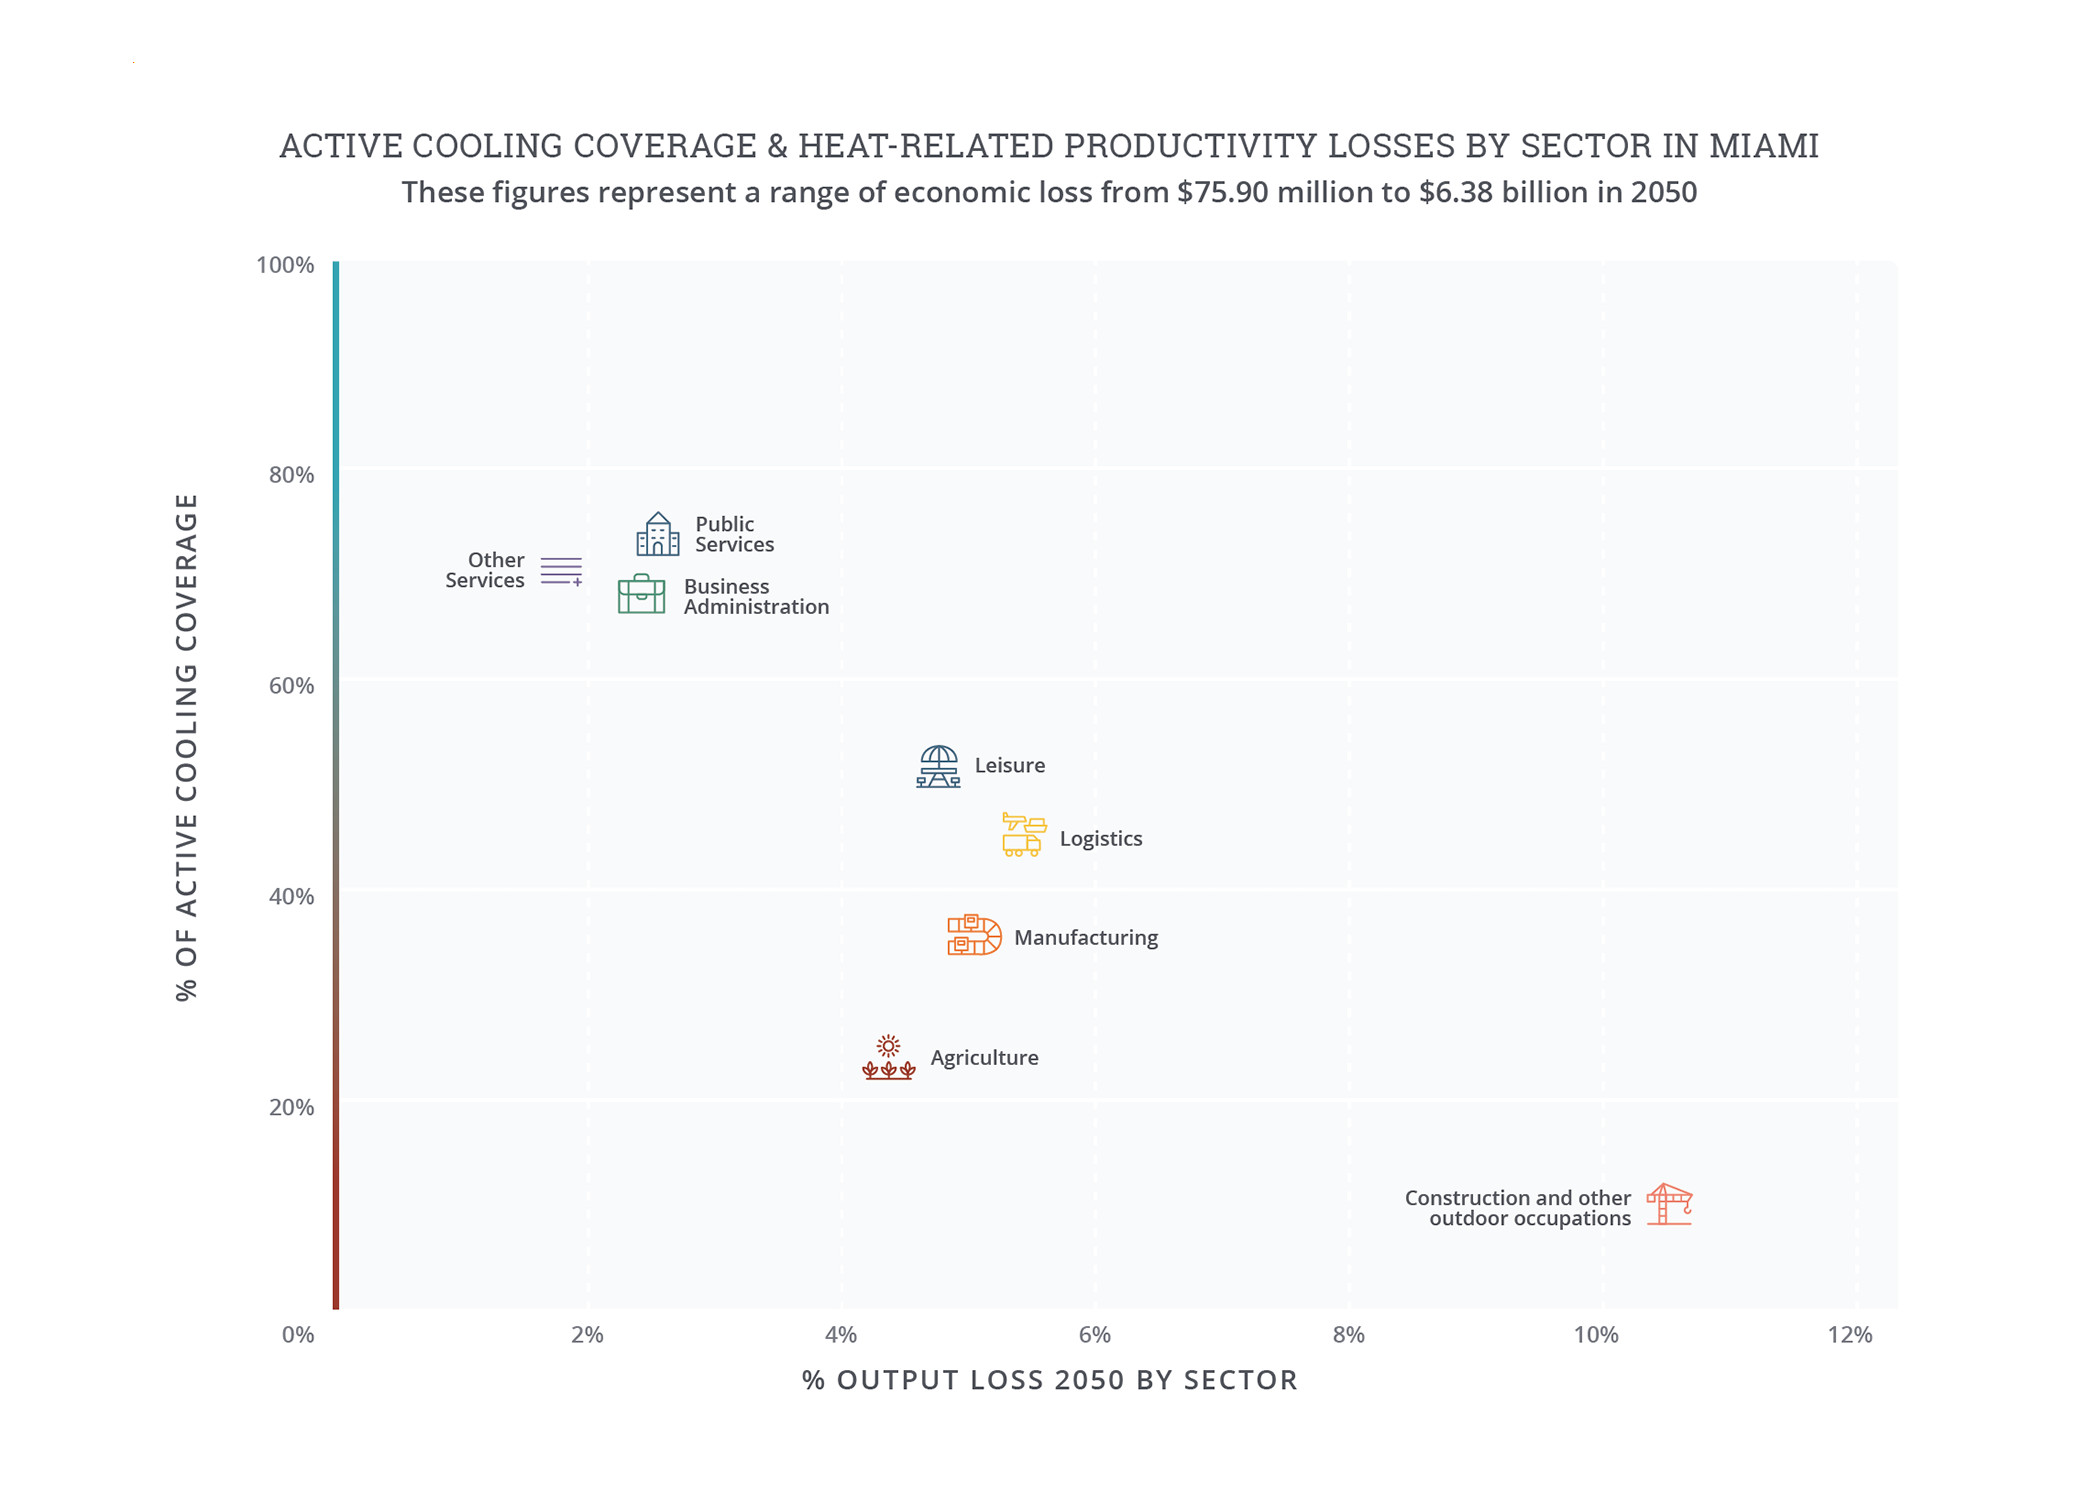
However, relative losses are concentrated in sectors that rely on outdoor work or that lack air-conditioning. This means that losses in productivity—and therefore wages—are likely to be highest in occupations where employees are least able to afford them, and where working conditions require more physical effort and more time exposed to heat. Construction, for example, accounts for less than 5 percent of economic activity in Miami, but generates 13 percent of total losses.
Miami’s losses in the business administration sector are driven by real estate, which includes property sales, rentals, leasing, and management. Real estate, finance, and insurance combined contribute USD 93 billion to Miami’s economy (25 percent of output). Workers such as real estate agents are relatively exposed to heat through activities such as outdoor or uncooled property showings and frequent travel between sites, leading to some heat exposure during about 30 percent of their working hours. Some industry sources globally already note the risks to agents working in the heat and recommend developing extreme heat and heat safety policies or avoiding scheduling showings during peak heat hours.
Health impacts of heat on Miami are expected to be concentrated among its elderly and minority populations. Extreme heat leads to heightened mortality and morbidity risk, particularly among the elderly population, which is more than one in five residents of Miami. Due to the rising temperatures caused by climate change, Miami can expect as much as 2.7 times more heat-related deaths per year by 2050 compared to 2020.22 Vulnerability is also concentrated in lower income and ethnic minority communities, who have less access to cooling green space, such as parks.23 Many also lack the resources to install or operate air-conditioning in their homes, with 57 percent of all low-income residents suffering from energy poverty.24 Data on emergency room visits and hospitalizations across Florida also show heightened rates of heat-related illnesses in lower-income neighborhoods.25


Note on “Projected number of hot and extremely hot days”: Days where the twenty-four hour average (i.e., daily) temperature exceeds the local 90th percentile of the baseline average daily temperature are defined as “hot days,” while days where the daily temperature exceeds the local 97.5th percentile are defined as “extreme hot days.” Because hot days are relative to typical local temperatures, the same daily temperature may be considered “hot” in one city but not another. The baseline is based on historical climate data, 1985-2005, while 2050 is based on the 2040-2060 climate projection from an ensemble of CMIP6 models under RCP 7.0.
Note on “Productivity losses by sector”: The agricultural sector captures loss within the defined city limits and does not account for agricultural loss from the surrounding rural areas. Baseline losses are based on historical climate data from 1985-2005 and economic data from 2019. 2050 losses are based on the 2040-2060 climate projection from an ensemble of CMIP6 models under RCP 7.0 and economic models under SSP3. Losses assume no change in sectoral composition of economy. Source: Vivid Economics.
Note on “Active cooling coverage and heat related productivity losses by sector”: O*NET, 2021; and analysis by Vivid Economics.
Extreme heat interventions
Miami is already a leading city in heat adaptation, but managing a problem on this scale will require a dramatic upscaling of activity. In May 2021, Miami appointed the world’s first Chief Heat Officer, who is coordinating actions in the Miami-Dade region. The ongoing efforts reduce the risks of heat and humidity through a variety of measures:
- Planning/policy: A proposed bill in Florida—requiring employers to provide 10 minutes of rest every two hours to outdoor workers when temperatures are above 90°F—could result in broader heat protection.26 The bill has received support from the Chief Heat Officer and many affected workers, including construction workers and farmers.27 Setting legal standards for heat-resilient infrastructure, public spaces, buildings, and landscapes will drive further private-sector adaptation.28
- Communications/outreach: Initiatives underway, including announcing heat seasons, creating heat safety public service announcements, and working with the community and workplaces to foster understanding of the risks of extreme heat, can all build resilience in area communities. Miami’s investment in developing data on heat exposure and resilience can help target future efforts to where investment can yield the biggest impact.29
- Investment in the built environment and nature-based solutions: The Million Trees Miami campaign aims to reach 30 percent tree canopy coverage in the city, providing shade and reducing urban heat intensification.30 Other planned activities include city-wide cooling stations, investing in heat mitigation for streets, public housing, and parks, and using tools, technologies, and innovative materials such as cool pavements, solar panel shading, and cooling architectural designs.31
Explore more city chapters
Return to the global summary
Endnotes
1 To estimate economic losses, this study goes beyond political boundaries to give a sense of how extreme heat and humidity impact Miami’s influence area. Core economic modeling considers Miami-Dade, Broward, and Palm Beach counties, otherwise known as the Core Based Statistical Area of Miami-Fort Lauderdale-Port St. Lucie. The regional approach is to ensure that analysis covers populations that are central to Miami’s growth and urban trajectory.
2 See Alyson Kenward et al., Summer in the City: Hot and Getting Hotter, Climate Central, 2014, http://assets.climatecentral.org/pdfs/UrbanHeatIsland.pdf.
3 All analysis is based on RCP 7.0 and SSP3 using an ensemble mean of CMIP6 models; see accompanying methodology document for details.
4 Analysis by Vivid Economics, based on summer average land surface temperature (LST), modeled climate data in 2050, and analysis of expected UHI and urban development from Kangning Huang et al., “Projecting Global Urban Land Expansion and Heat Island Intensification through 2050,” Environmental Research Letters 14, no. 11, 2019, https://iopscience.iop.org/article/10.1088/1748-9326/ab4b71.
5 Economic data in this report are from 2019 to avoid capturing the effect of COVID-19 on the economies of the cities analyzed; see methodology.
6 Miami-Dade County, “Budget in Brief,” 2021-22 proposed budget, https://www.miamidade.gov/budget/library/fy2021-22/proposed/budget-in-brief.pdf. The workability analysis is based on climate factors and not indoor working conditions determined by built environment characteristics or workplace layout (e.g., equipment that generates heat, body heat in close spaces, ventilation or greenhouse effects from windows, external shading). In practice, some of these factors can make indoor environments hotter than the modeled climate conditions suggest.
7 All output is measured based on gross value added (GVA), or the value of goods and services produced in an area.
8 Workability losses are based on the share of productive working hours possible given the limitations of human heat stress.
9 GVA data from finance, insurance, real estate, rental, and leasing subsector in the 2019 census.
10 Heat exposure in working conditions from O*NET, 2021; and analysis by Vivid Economics.
11 See e.g., CRES, “Selling Homes During Extreme Heat Conditions,” Blog, Arthur J. Gallagher & Co. division, accessed September 2022, https://www.cresinsurance.com/selling-homes-during-extreme-heat-conditions/; and Property Finder, “For Agents: Tips for Showing Properties in the Summer,” Blog, June 7, 2018, https://www.propertyfinder.bh/blog/for-agents-tips-for-showing-properties-in-the-summer/.
12 GVA data from finance, insurance, real estate, rental, and leasing subsector in the 2019 census.
13 “Miami Area Employment—July 2022,” US Bureau of Labor Statistics, Southeast Information Office, https://www.bls.gov/regions/southeast/news-release/areaemployment_miami.htm.
14 Analysis by Vivid Economics.
15 Heat exposure in working conditions from O*NET, 2021; analysis by Vivid Economics.
16 R. Jisung Park et al., Temperature, Workplace Safety, and Labor Market Inequality, Institute of Labor Economics (IZA), IZA DP No. 14560, July 2021, https://docs.iza.org/dp14560.pdf.
17 Alex Harris and Syra Ortiz-Blanes, “‘Water, Rest, Shade’: The Fight to Protect Florida’s Outdoor Workers from Extreme Heat,” Miami Herald, February 5, 2022, https://www.miamiherald.com/news/local/environment/article257885013.html.
18 Stevan Novakovic, “Impact and Outlook for Florida’s Green Industry,” Florida Nursery, Growers and Landscape Association (FNGLA) and Farm Credit of Central Florida, 2022, https://www.fngla.org/2022-Economic-Impact-Florida%20s-Nursery-Landscape-Industry.Optimized.pdf.
19 Florida International University and WeCount!, “Mapping Memories: Immigrant Agricultural Workers Seek Climate Justice,” in Climates of Inequality: Stories of Environmental Justice (public memory project), 2021, https://climatesofinequality.org/project/introduction-homestead-florida/
20 Analysis by Vivid Economics.
21 WLRN, “Study: South Dade Plant Nursery Workers Earn Low Pay, Susceptible to Heat Illnesses,” July 30, 2019, https://www.wlrn.org/news/2019-07-30/study-south-dade-plant-nursery-workers-earn-low-pay-susceptible-to-heat-illnesses.
22 Analysis by Vivid Economics, based on heat-mortality vulnerability functions from the C40 Cities benefits tool; see “Resilient Cities: Measuring Benefits of Urban Heat Adaptation,” C40 Cities, 2021, https://www.c40knowledgehub.org/s/article/Heat-Resilient-Cities-Measuring-benefits-of-urban-heat-adaptation?language=en_US.
23 M. L. Allain and T. W. Collins, “Differential Access to Park Space Based on Country of Origin within Miami’s Hispanic/Latino Population: A Novel Analysis of Park Equity,” International Journal of Environmental Research and Public Health 18, no. 16 (2021): 8364, https://doi.org/10.3390/ijerph18168364; and Miami Dade County, Park Access and Equity Strategy, accessed June 2022, https://www.miamidade.gov/parks/library/access-equity-strategy.pdf.
24 “Energy & Buildings,” Miami-Dade County (website), accessed June 2022, https://www.miamidade.gov/global/economy/resilience/climate-strategy/energy-buildings.page.
25 Sofia Moutinho and Elisabeth Gawthrop, “Dangerous Heat, Unequal Consequences,” Center for Public Integrity, 2021, https://publicintegrity.org/environment/hidden-epidemics/dangerous-heat-illness-unequal-consequences/.
26 Harris and Ortiz-Blanes, “‘Water, Rest, Shade’: The Fight to Protect Florida’s Outdoor Workers.”
27 Harris and Ortiz-Blanes, “‘Water, Rest, Shade’: The Fight to Protect Florida’s Outdoor Workers.”
28 Miami-Dade County Extreme Heat Toolkit, 2021, https://www.miamidade.gov/green/library/heat-toolkit.pdf
29 Miami-Dade County Extreme Heat Toolkit.
30 “Million Trees Miami,” Miami Dade County (website), accessed September 2022, https://www.miamidade.gov/global/recreation/milliontrees/home.page.
31 Miami-Dade County Extreme Heat Toolkit.
