Overview
In Sydney’s worst heat waves, temperatures exceed 45°C and high heat can coincide with other hazards such as bushfire and drought. The effects of unabated climate change could cause hot days to become 60 percent or more frequent by 2050.
Heat is a particular concern in Western Sydney, where the local microclimate and urban design features such as dark roofs combine to cause temperatures up to 15°C more than rural surroundings. These hotspots in Western Sydney are likely to expand in that area by 2050.
Heat exposure within Sydney already causes labor productivity losses that could amount to USD 310 million (AUD 432 million) in lost output in a typical year currently—in contrast, flooding costs all of New South Wales around USD 180 million (AUD 250 million) every year. Without further adaptation, worsening conditions for exposed workers may double heat- and humidity-related labor productivity losses to more than USD 700 million (AUD 974 million) by 2050. This analysis does not capture the effect of lost labor productivity on wages, demand, or other components of the broader economy and should be viewed as a conservative estimate of the economic effect of heat in Sydney.
The high heat vulnerability of the elderly will also increase already notable mental and physical burdens on the 15,000 largely low-paid residents who are employed as caregivers—as well as the one-in-nine residents who have informal care duties.
Extending existing efforts to improve resilience to heat and considering early warning systems based on the health impact of forecasted weather conditions could help protect more people and reduce heat-related mortality.
Extreme heat conditions
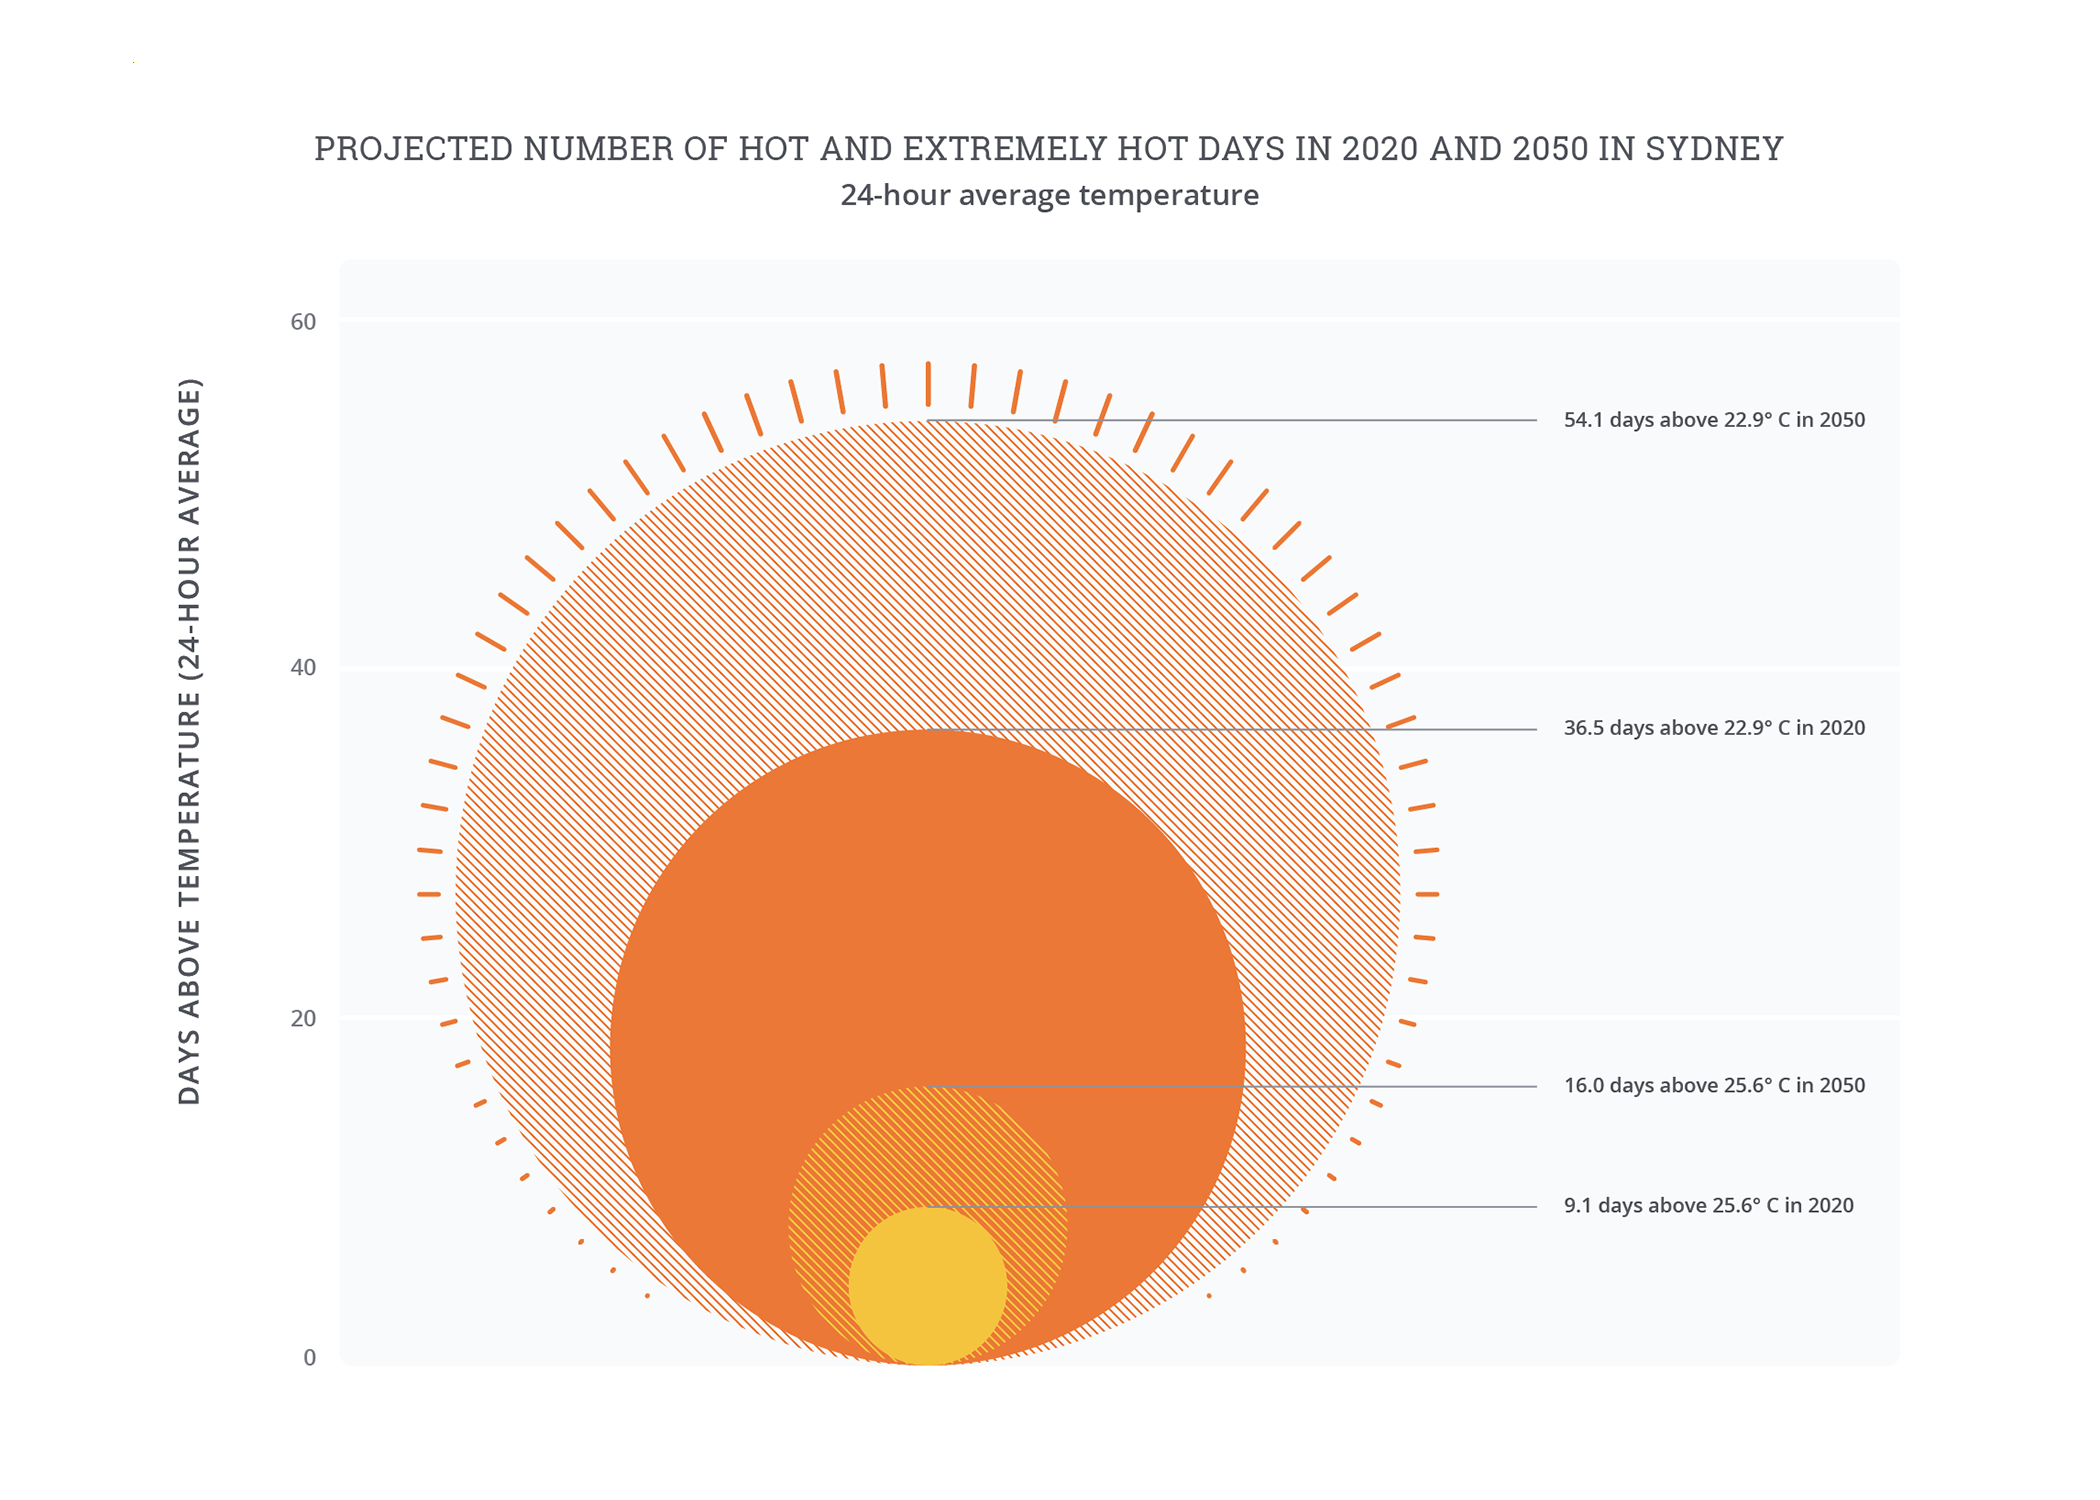
Sydney1 already experiences high temperatures, often at the same time as bushfires or drought, and the hottest days are expected to become much more common. In a normal year, the hottest ten days average more than 25.6°C over twenty-four hours, which can reflect both warm nights that provide little respite from the heat of the day or extreme daytime heat: during heat waves, temperatures can top 45°C.2 By 2050,3 unabated climate change could lead to an increase of between 60 percent and 75 percent in the frequency of the most extreme heat days, from only nine or ten per year to sixteen or more.
Geography and urban design mean districts in Western Sydney can be 15°C4 hotter than the rest of the city. Western Sydney is a largely working-class region of Greater Sydney that includes nearly half of its population and is the third-largest economy in Australia on its own.5 Western Sydney also has a naturally hotter microclimate than the rest of the city, facing warmer desert winds from the interior rather than the coastal winds prevalent elsewhere in the city. This is compounded by hard surfaces such as roads and parking lots, sparse tree coverage in residential areas, as well as design choices such as dark roofs that can make parts of the area up to 15°C hotter than surrounding rural areas. Under a high emissions scenario, by 2050 the prevalence of these extreme urban hotspots is likely to expand to cover most of Western Sydney.
Heat localized hotspots affect quality of life beyond immediate health and productivity effects. Recent studies have found that surface temperatures in playgrounds in Sydney can reach as much as 70°C.6 These temperatures are so severe they don’t simply discourage active outdoor play, but present serious danger to children who try to use the equipment: the surfaces are hot enough to cause second-degree burns in only thirty seconds.7
Impact of extreme heat
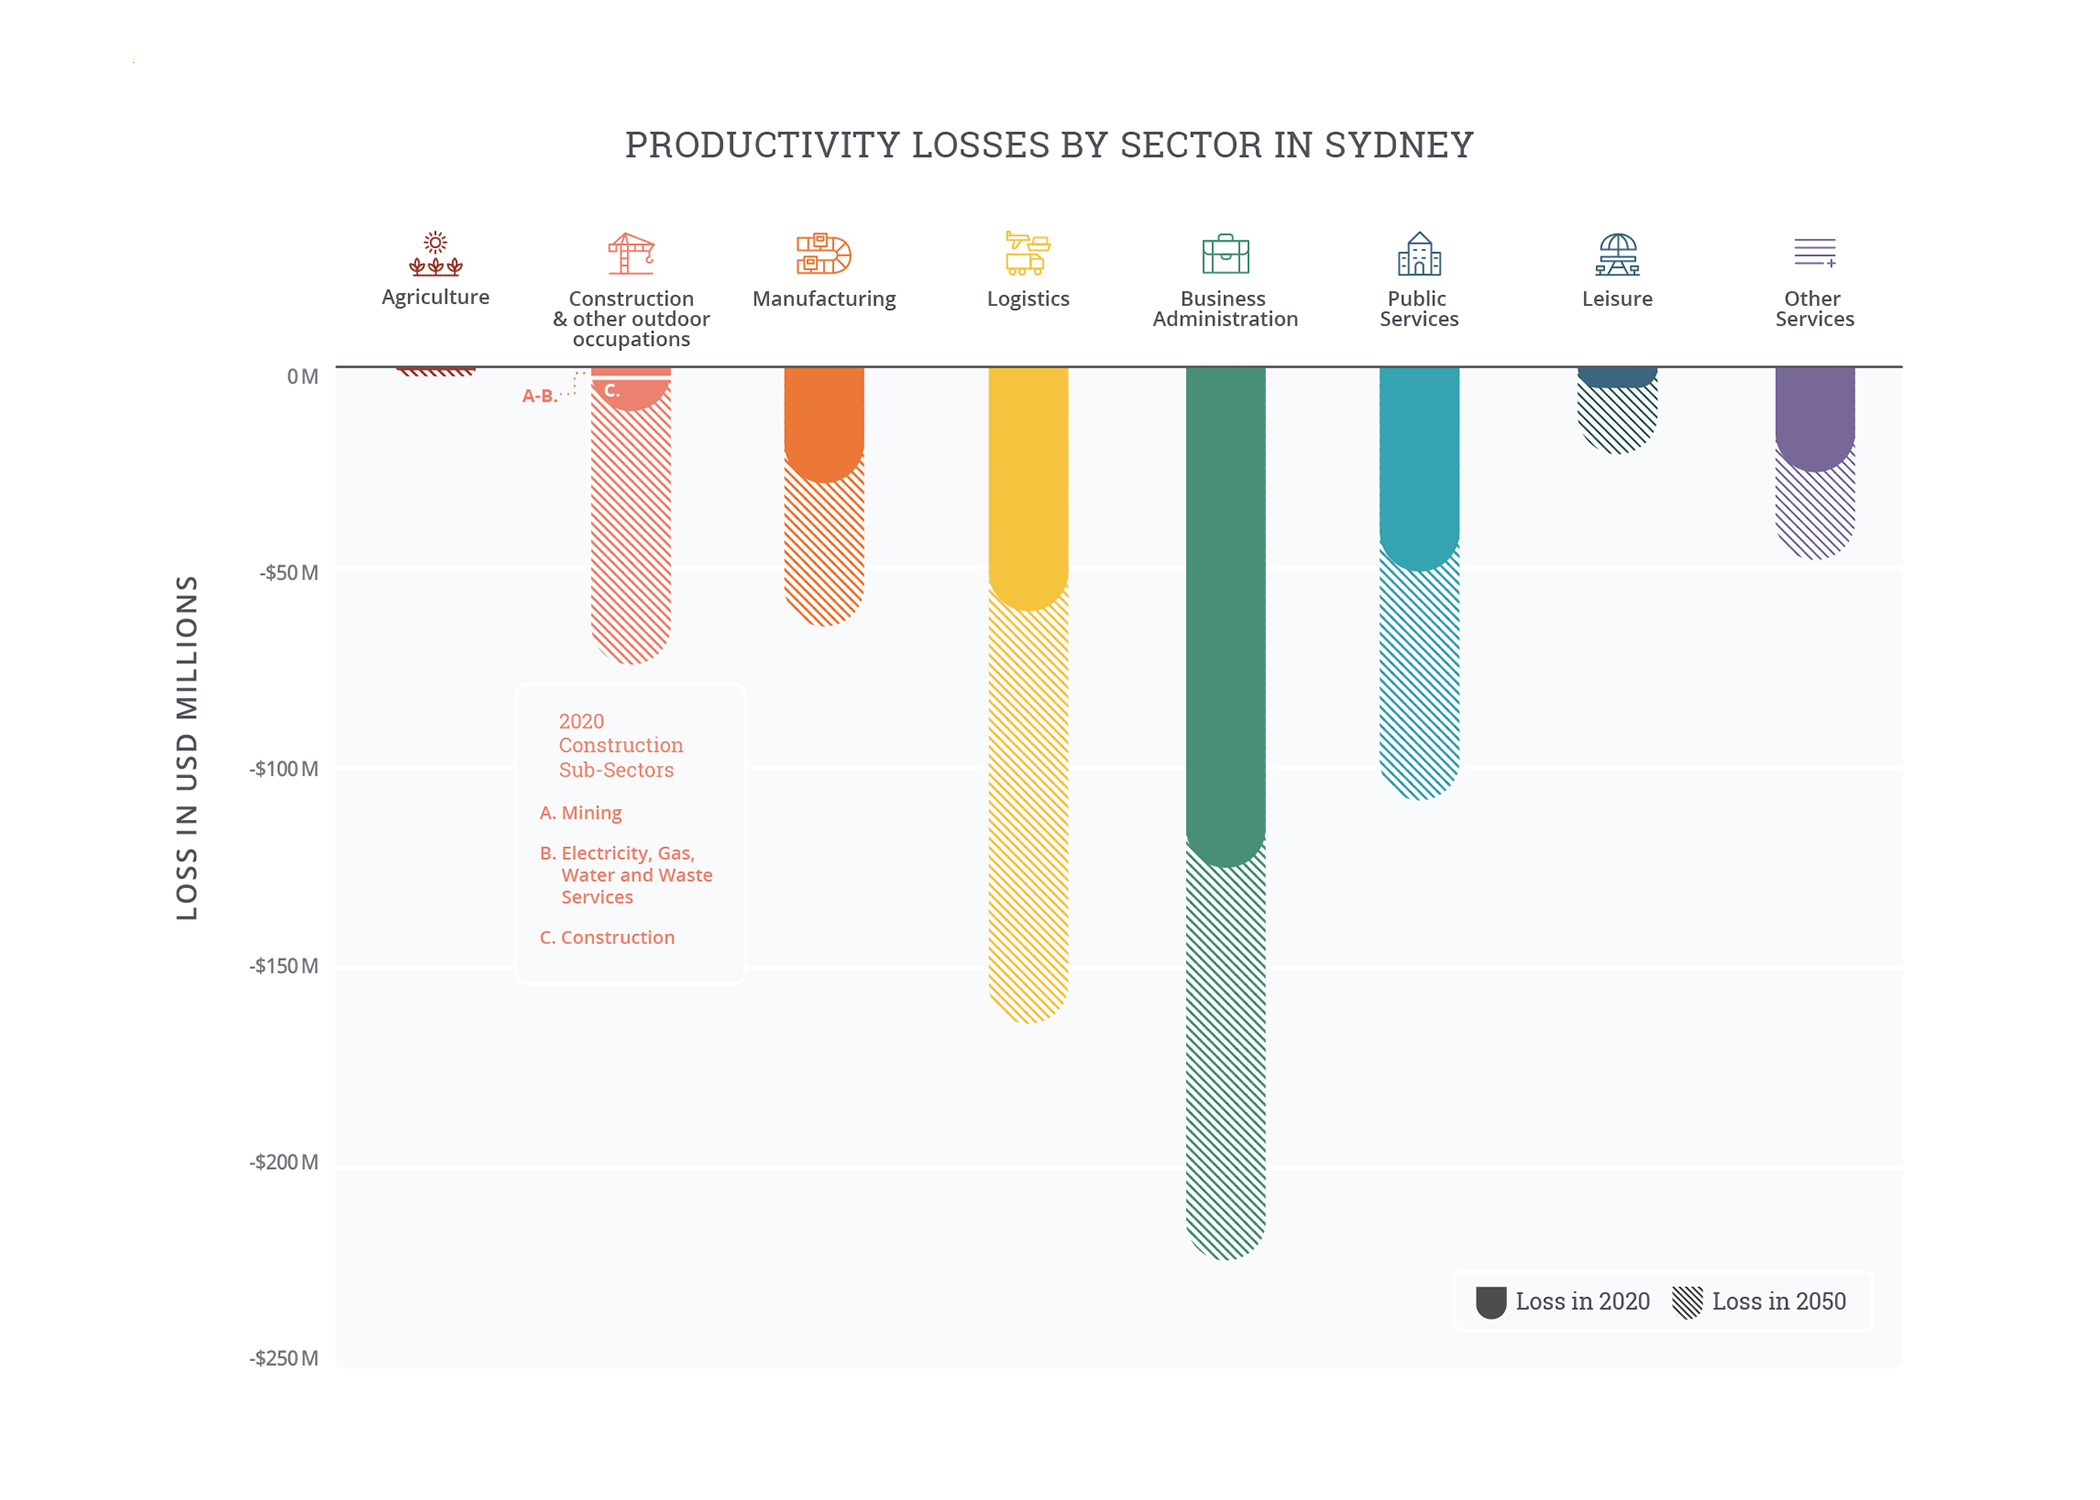
The combined impact of exposure to high heat and humidity8 within Sydney already causes labor productivity losses that could amount to USD 310 million9 (AUD 432 million),10 not including the broader economic impact of reduced wages. These losses are even greater than those caused by floods across New South Wales, which are estimated to be approximately USD 180 million (AUD 250 million) in a typical year.11 Labor productivity losses are concentrated in the largest sectors of employment and economic activity in the city: business administration (e.g., accountants and real estate agents), logistics (e.g., warehouse workers and delivery drivers), and public services (e.g., police officers and teachers). These sectors together represent over 70 percent of the economic activity in Sydney, and over 75 percent of its modeled losses in the historical baseline climate, or almost USD 235 million (AUD 327 million). Labor productivity losses are experienced primarily as lost wages to workers, serving to reduce overall economic output and drag down businesses and the public sector in addition to individual households.
Without action to reduce emissions or adapt to climate change, worsening conditions for outdoor workers may drive labor productivity losses to more than double to over USD 700 million (AUD 974 million) by 2050. The greatest increase in losses is projected to be in sectors such as construction and utilities; temperatures that inhibit manual work are likely to become more common during working hours. Under conservative economic projections, losses in these sectors rise from around USD 10 million (AUD 14 million) in 2020 to USD 75 million (AUD 104 million) by 2050. Losses could be even higher if the broader impacts of heat are considered such as heat-induced heavy machinery failures in the manufacturing sector or indirect effects such as transportation disruptions and more serious heat-related health issues.
Rising temperatures could exacerbate underlying health conditions and place additional stress on caregivers. Sydney’s aging population and rising temperatures mean that the health impacts of heat are likely to increase just as work in healthcare becomes more challenging and less productive. The percentage of Sydney’s population aged 65 or older is projected to increase from 15 percent today to 20 percent by 2050. Accounting for population growth, this amounts to an increase in the elderly population of more than 400,000 people. More broadly, Sydney’s population will face a 40 percent increase in the number of hot, high risk days in a year.12 Home care work is one of the most exposed occupations in the healthcare sector, and workers face current and increasing challenges due to extreme heat.13


Note on “Projected number of hot and extremely hot days”: Days where the twenty-four hour average (i.e., daily) temperature exceeds the local 90th percentile of the baseline average daily temperature are defined as “hot days,” while days where the daily temperature exceeds the local 97.5th percentile are defined as “extreme hot days.” Because hot days are relative to typical local temperatures, the same daily temperature may be considered “hot” in one city but not another. The baseline is based on historical climate data, 1985-2005, while 2050 is based on the 2040-2060 climate projection from an ensemble of CMIP6 models under RCP 7.0.
Note on “Productivity losses by sector”: The agricultural sector captures loss within the defined city limits and does not account for agricultural loss from the surrounding rural areas. Baseline losses are based on historical climate data from 1985-2005 and economic data from 2019. 2050 losses are based on the 2040-2060 climate projection from an ensemble of CMIP6 models under RCP 7.0 and economic models under SSP3. Losses assume no change in sectoral composition of economy. Source: Vivid Economics.
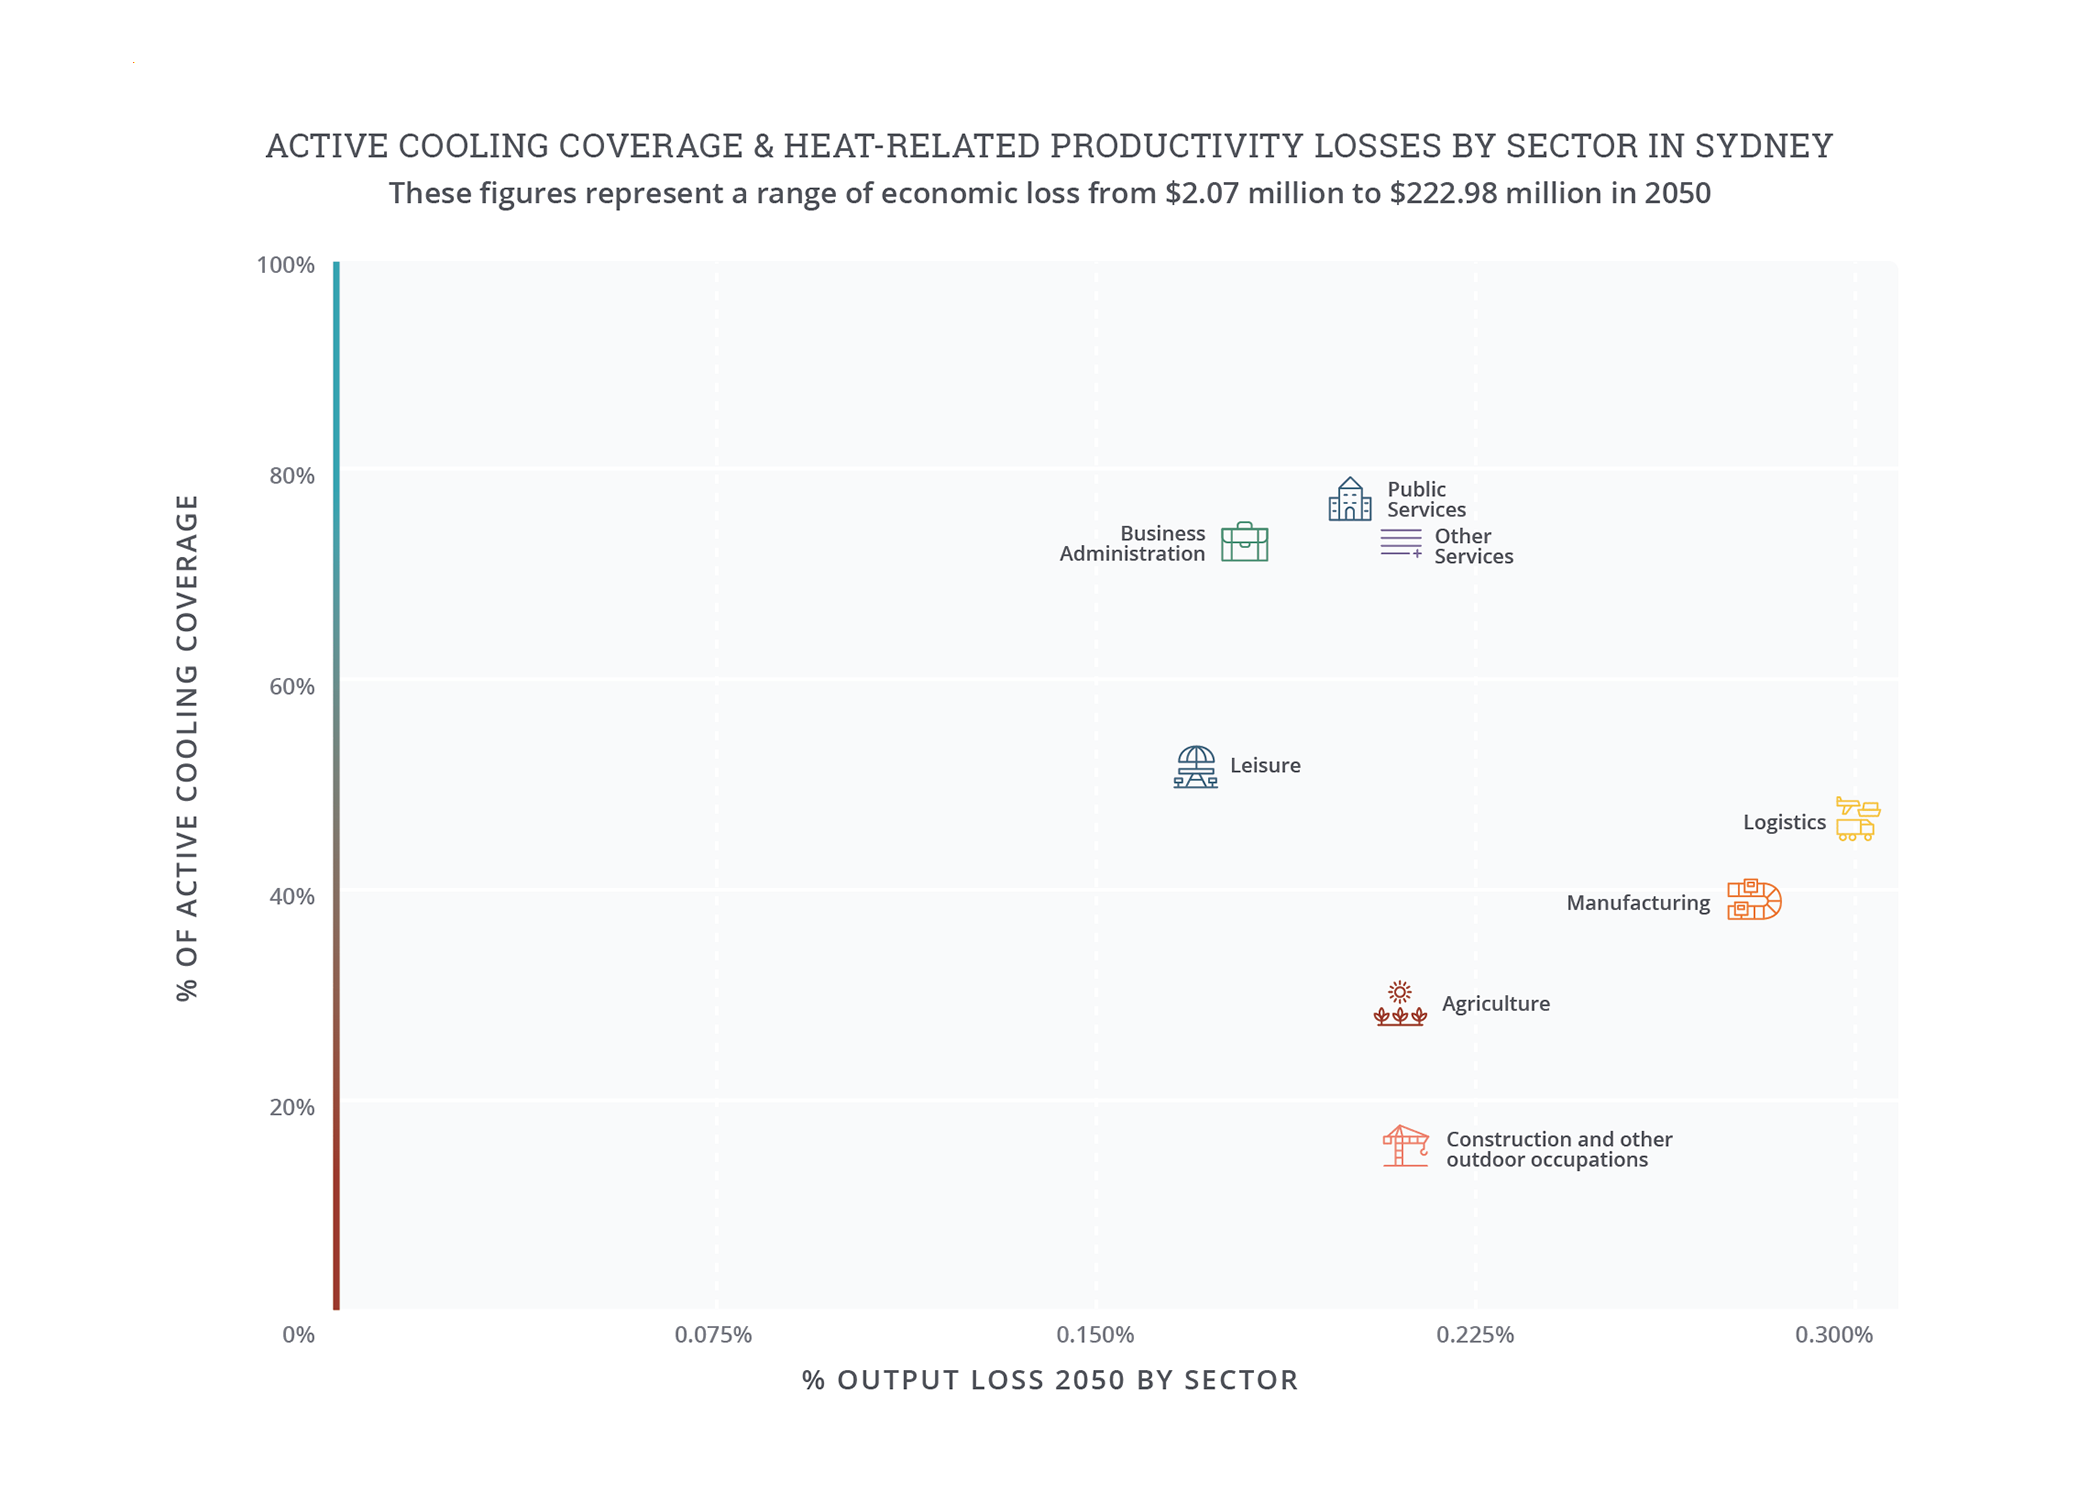
Note on “Active cooling coverage and heat related productivity losses by sector”: O*NET, 2021; and analysis by Vivid Economics.
Extreme heat interventions
Sydney is working to protect its population from heat through a combination of regulation, informational campaigns, and direct investments in heat reduction. Current actions include:
- Policy/planning: A ban on dark roofs was proposed,20 which could have helped mitigate some of the extreme heat, although the plan was recently abandoned.21 Supportive guidelines provided by organizations such as the Western Sydney Regional Organisation of Councils (WSROC) can promote heat-reducing and heat-resilient urban planning.22
- Communications/outreach: The Heat Smart Resilience Framework from WSROC23 provides support and ideas for people to adopt their own ways of coping with and being safe in extreme heat, and heat-wave forecasting from Australia’s Bureau of Meteorology can provide the basis for launching public-safety campaigns to disseminate this information.24
- Investment in the built environment and nature-based solutions: The Resilient Sydney 2018 strategy outlines ongoing and intensifying efforts to reduce heat in the city, including “cool roofs, permeable or porous roads, driveways and footpaths, cool building and shading designs, and irrigation and tree canopy cover.”25 Greening Sydney 2030 expands on existing efforts and proposes investing in green roofs and walls as well as tree cover.26
Explore more city chapters
Return to the global summary
Endnotes
1 To estimate economic losses, this study goes beyond political boundaries to give a sense of how extreme heat and humidity impact Sydney’s influence area. Core economic modeling considers the Metropolitan Sydney Area, otherwise known as SA2 – Statistical Area 2. The regional approach is to ensure that analysis covers populations that are central to Sydney’s growth and urban trajectory.
2 “Climate Statistics for Australian Locations,” Bureau of Meteorology (website), monthly data, 1991-2020, accessed September 2022, http://www.bom.gov.au/jsp/ncc/cdio/cvg/av?p_stn_num=066062&p_prim_element_index=0&p_comp_element_index=0&redraw=null&p_display_type=full_statistics_table&normals_years=1991-2020&tablesizebutt=normal.
3 All analysis is based on RCP 7.0 and SSP3 using an ensemble mean of CMIP6 models; see accompanying methodology document for details.
4 Analysis by Vivid Economics, based on summer average land surface temperature (LST), modeled climate data in 2050, and analysis of expected urban heat island (UHI) and urban development from Kangning Huang et al., “Projecting Global Urban Land Expansion and Heat Island Intensification through 2050,” Environmental Research Letters 14, no. 11, 2019, https://iopscience.iop.org/article/10.1088/1748-9326/ab4b71.
5 “About Greater Western Sydney,” Regional Centre of Expertise on Education for Sustainable Development–Greater Western Sydney (RCE-GWS), Western Sydney University (website), drawing on the Greater Western Sydney Region Community Profile, using Australian Bureau of Statistics Census Data, 2016, https://www.westernsydney.edu.au/rcegws/rcegws/About/about_greater_western_sydney.
6 Emily McPherson, “Sizzling Playground Surfaces at Sydney School Hit 70C,” 9 News, January 28, 2021, https://www.9news.com.au/national/sizzling-playground-area-at-sydney-school-top-70-degrees-study-finds/64099c4b-5592-41c5-abd9-cc278cc6b7b3.
7 Shireen Khalil, “Sydney Mum Issues Dire Warning over Playground Problem,” News.com.au, February 16, 2022, https://www.news.com.au/lifestyle/real-life/news-life/sydney-mum-issues-dire-warning-over-playground-problem/news-story/cc598f5f32c214cfd5661366503e0a62; and S. Saquib, MD, et al., “Management of Pediatric Pavement Burns,” Journal of Burn Care & Research 42, no. 5 (2021): 865–869, https://doi.org/10.1093/jbcr/irab084.
8 The analysis uses wet bulb globe temperature (WBGT) as a measure of perceived temperature to capture the effects of weather on human health and productivity.
9 Economic data in this report are from 2019 to avoid capturing the effect of COVID-19 on the economies of the cities analyzed; see methodology for further details.
10 Numbers are approximate and rounded to the nearest 10. Exchange rates from International Monetary Fund (2022). 2021 annual average exchange rate – 1.39 AUD/USD. Available at https://data.imf.org/regular.aspx?key=61545850.
11 “Climate Change Impacts on Storms and Floods,” AdaptNSW (website), Government of New South Wales, accessed September 2022, https://www.climatechange.environment.nsw.gov.au/storms-and-floods.
12 Defined as days where the average temperature over a twenty-four hour period exceeds the local 90th percentile of average daily temperatures—i.e., the hottest thirty-six to thirty-seven days in a typical year.
13 Analysis by Vivid Economics, based on heat-mortality vulnerability functions from the C40 Cities benefits tool; see “Resilient Cities: Measuring Benefits of Urban Heat Adaptation,” C40 Cities, 2021, https://www.c40knowledgehub.org/s/article/Heat-Resilient-Cities-Measuring-benefits-of-urban-heat-adaptation?language=en_US.
14 “People Using Aged Care,” Australian Institute of Health and Welfare (website), States and Territories (section), Aged Care data, updated April 29, 2022, accessed September 2022, https://www.gen-agedcaredata.gov.au/Topics/People-using-aged-care#States%20and%20territories.
15 Australian Department of Health, 2020 Aged Care Workforce Census Report, 2020, https://www.health.gov.au/sites/default/files/documents/2021/10/2020-aged-care-workforce-census.pdf.
16 Emily McPherson, “On as Little as $26 an Hour, Home Care Workers Are Being Hit with Petrol Price, RATs Double Whammy,” 9News.com.au, March 29, 2022, https://www.9news.com.au/national/sydney-aged-care-workers-call-for-wage-increase-hit-with-petrol-prices-rats-double-whammy/d41c4c95-0185-4a07-b5e2-e24e8c18bd2c.
17 Climate Justice Research Centre, High Heat and Climate Change at Work: Report for the United Workers Union, University of Technology Sydney, September 2021, https://unitedworkers.org.au/wp-content/uploads/2021/09/UWU-Final-Report.pdf.
18 Australian Department of Health, “Home Care/CHSP Service: Caring for Older People in Warmer Weather,” Commonwealth Health Support Programme, 2020, https://www.health.gov.au/sites/default/files/documents/2020/01/caring-for-older-people-in-warmer-weather-home-care-and-chsp_0.pdf.
19 Australian Bureau of Statistics, “Disability, Ageing and Carers, Australia: Summary of Findings (for 2018),” released 2019, https://www.abs.gov.au/statistics/health/disability/disability-ageing-and-carers-australia-summary-findings/latest-release.
20 Donna Lu, “Hot in the City: Can a Ban on Dark Roofs Cool Sydney?,” Guardian, November 20, 2021, https://www.theguardian.com/australia-news/2021/nov/21/hot-in-the-city-can-a-ban-on-dark-roofs-cool-sydney.
21 Elias Visontay, “Plan to Ban Dark Roofs Abandoned as NSW Government Walks Back Sustainability Measures,” Guardian, April 8, 2022, https://www.theguardian.com/australia-news/2022/apr/09/plan-to-ban-dark-roofs-abandoned-as-nsw-government-walks-back-sustainability-measures.
22 “Urban Heat Planning Toolkit,” WSROC (website), accessed September 2022, https://wsroc.com.au/projects/project-turn-down-the-heat/turn-down-the-heat-resources-2.
23 “Building Resilience to Heatwaves: Heat Smart Western Sydney,” WSROC (website), accessed September 2022, https://wsroc.com.au/projects/project-turn-down-the-heat/turn-down-the-heat-resources-4.
24 “Heatwave Service for Australia,” Australia Bureau of Meteorology, accessed 2022, http://www.bom.gov.au/australia/heatwave/.
25 Resilient Sydney: A Strategy for City Resilience 2018, City of Sydney on behalf of the metropolitan Councils of Sydney, with the support of 100 Resilient Cities, now called Resilient Cities Network, https://www.preventionweb.net/publication/resilient-sydney-strategy-city-resilience-2018.
26 Sarah Wray, “Sydney to Cover 40 Percent of the City in Greenery to Beat Heat,” Cities Today magazine, 2021, https://cities-today.com/sydney-to-cover-40-percent-of-the-city-in-greenery-to-beat-heat/; and Greening Sydney Strategy, City of Sydney, July 2021, https://www.cityofsydney.nsw.gov.au/strategies-action-plans/greening-sydney-strategy.
