Overview
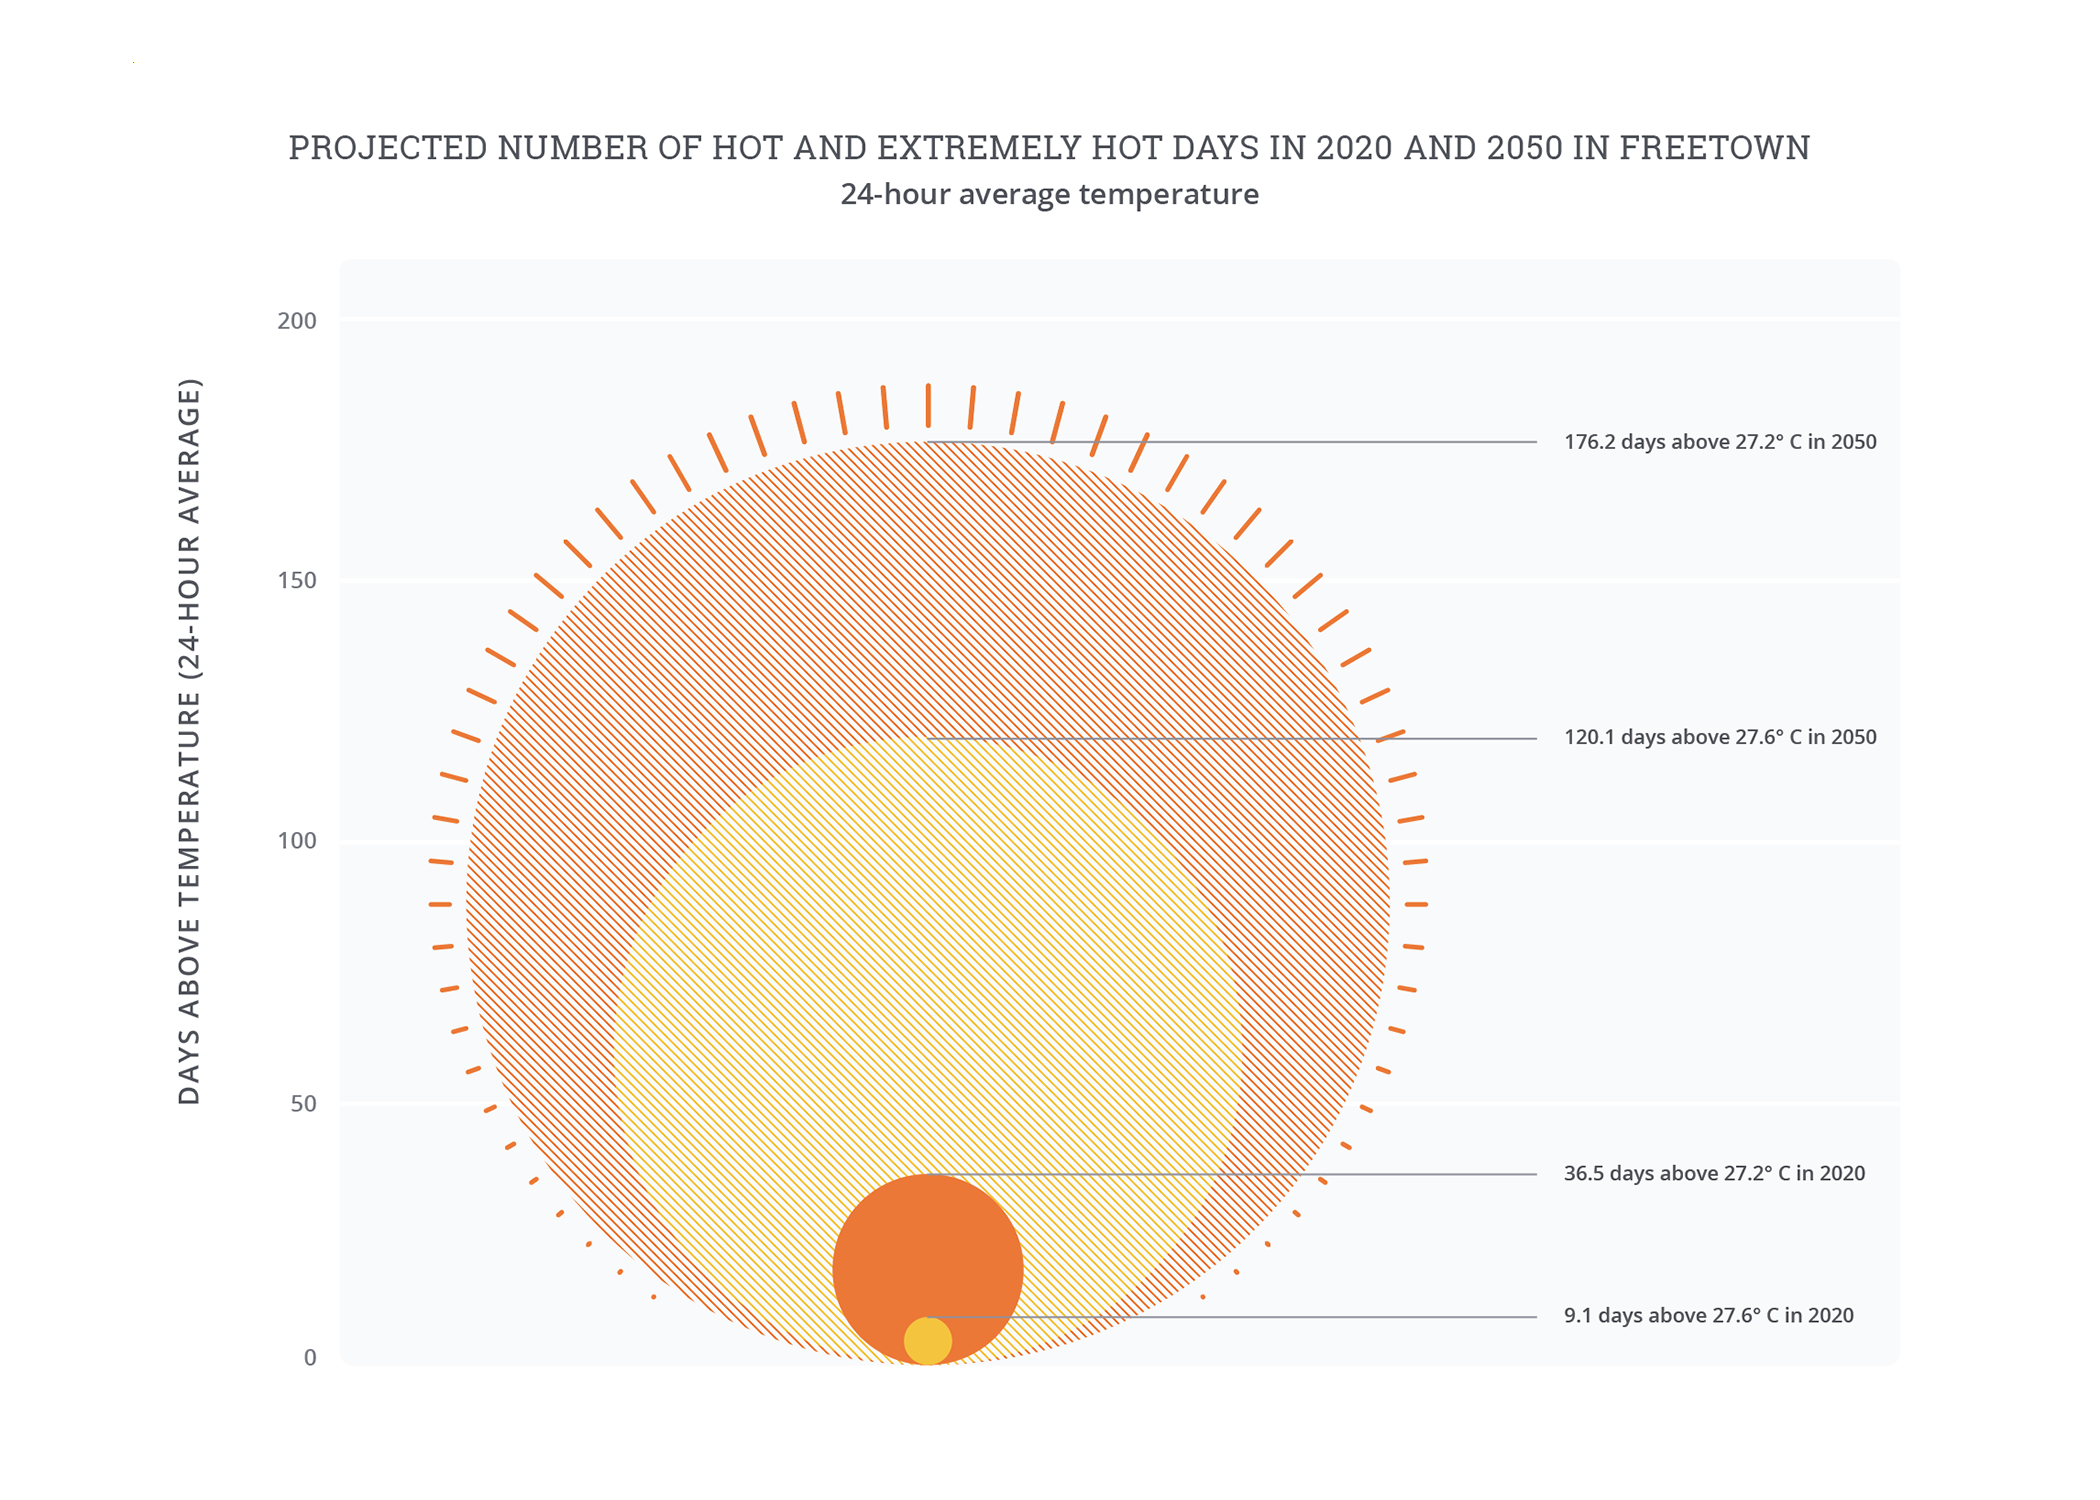
Freetown is a city that rarely cools down: its equatorial climate has little seasonal or daily variation in temperature, giving limited respite from the heat. By 2050, around 120 days, or four months, every year will be as warm as the hottest ten days currently.
Rapid population growth has left Freetown with low levels of green cover and many bare, paved, or otherwise heat-intensifying surfaces, particularly around informal settlements such as Kroo Bay.
Freetown’s lost output from heat- and humidity-related labor productivity reductions is already significant (3.5 percent of total output), and year-round temperature increases are set to push these losses to over 6 percent of output by 2050—the second-largest share of losses out of all cities in the study.
The economy faces particularly high losses as it relies on labor-intensive production with more than 90 percent of working hours vulnerable to heat. The impacts of these losses will bear most heavily on the poor, including the 60 percent of the population who live in informal settlements.
More than any other city in this study, Freetown faces the dual challenges of socioeconomic development and adaptation. Freetown can take an integrated approach to these challenges, making climate-proof investments to secure its future economy.
Freetown is highly vulnerable to extreme heat: more than 90 percent of work hours are in nonclimate-controlled conditions.
Impacts of heat
Freetown1 is a city that rarely cools down: its equatorial climate has little seasonal or daily variation in temperature, giving limited respite from the heat. Days are hot and nights remain warm—average overnight temperatures remain over 23°C, year-round. This means that the impacts of hot weather are felt year-round, with fewer opportunities for adjusting the timing of work and life activities to avoid the heat completely. In a typical year currently, the nine to ten hottest days of the year (the 97.5th percentile) have an average temperature over twenty-four hours of at least 27.6°C, which is not particularly high compared to other cities in the study—but the persistent weather conditions mean that many more days lie just below this threshold. Consequently, by 2050 climate change is expected to lead to 120 days, or four months every year, which are as hot as the ten hottest days currently.2
Freetown’s heat- and humidity-related labor productivity losses will rise to over 6 percent of output by 2050—the second-largest share of output losses out of all the cities in the study.
Rapid urban development and migration has left Freetown with low levels of green cover and many bare, paved, or otherwise heat-intensifying surfaces, particularly around informal settlements such as Kroo Bay. Despite the benefits of its coastal position and the cooling effects of Western Area Peninsula National Park, Freetown suffers from a significant urban heat island (UHI) effect.3 A historical legacy of deforestation,4 as rural-urban migration increased demand for cleared land to settle on and production of charcoal to cook with,5 has significantly reduced the number of trees just as the growing population increased the number of people exposed to rising urban heat in the city. Uninsulated buildings with metal roofs, which are typical ruction in these informal communities,6 experience higher temperature peaks but cooler nighttime lows.7
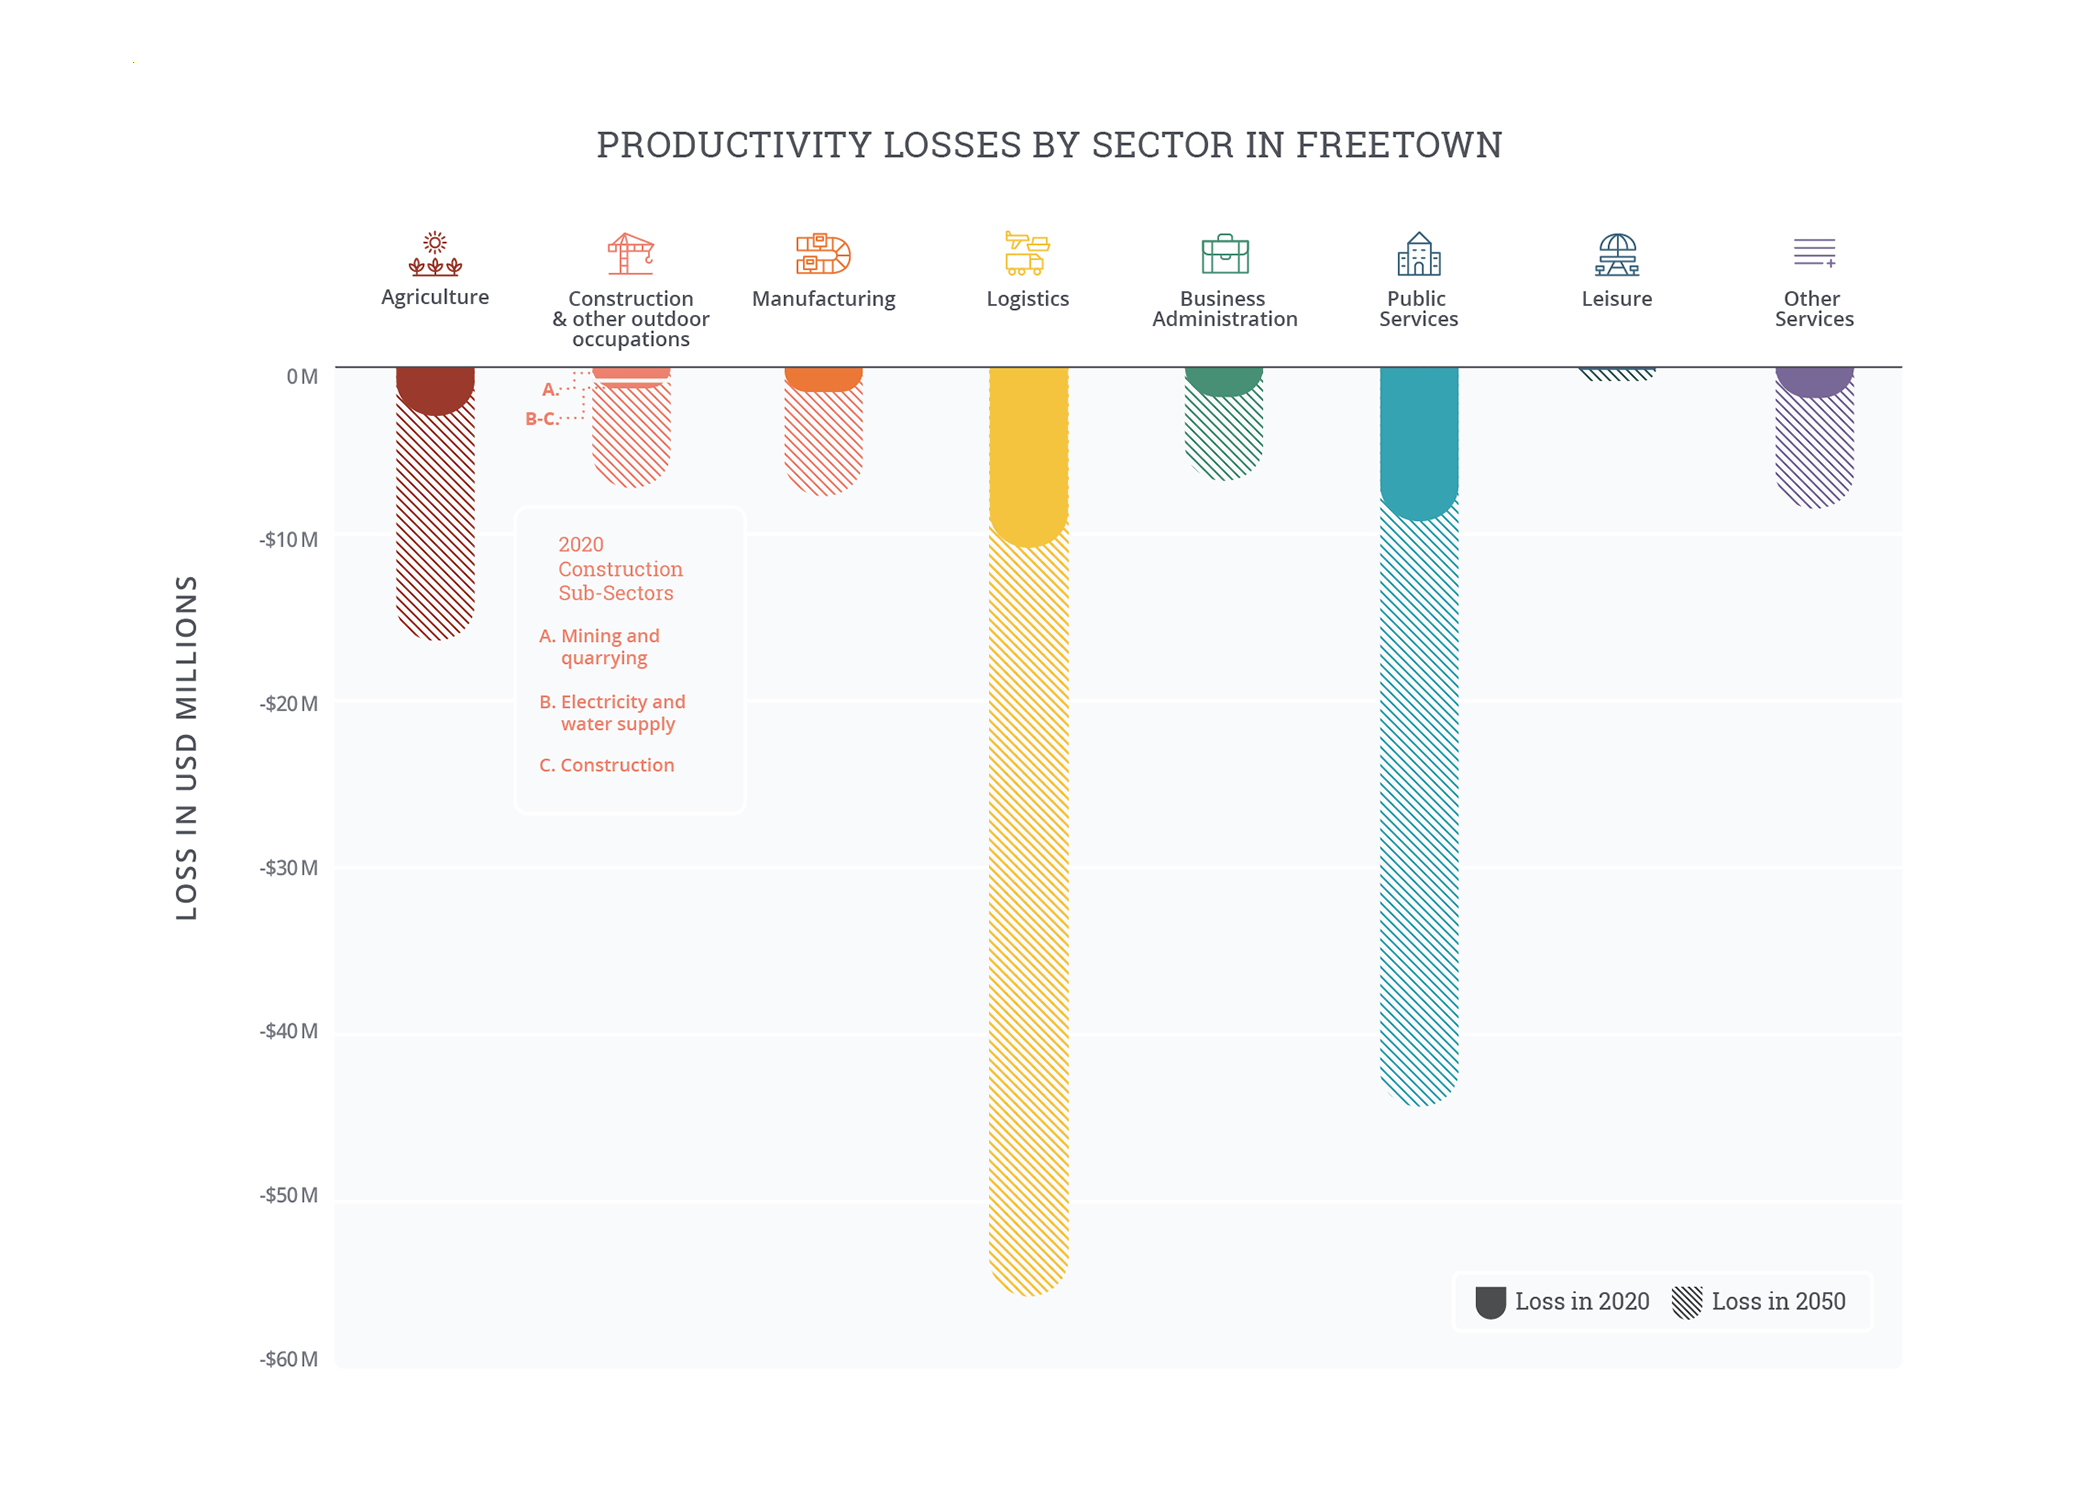
Freetown’s heat- and humidity-related labor productivity losses are already substantial, and year-round temperature increases are set to push these impacts to losses of over 6 percent of output by 2050—the second-largest share of output losses out of all the cities in the study.8 Overall, in a typical year around 2020,9 heat- and humidity-related productivity reductions may cause losses of as much as 3.5 percent of output, or almost USD 30 million (USD 29.5 million / SLL 369 billion).10
While other cities typically suffer almost no losses over their winter months, Freetown’s uniform heat leads to a sharper projected increase in overall output loss, as more days fall above the workability threshold of 25°C wet bulb globe temperature (WBGT), at which productivity losses kick in. By 2050, without global reductions in emissions or local adaptation to the climate, the increase in heat from climate change may drive heat- and humidity-related productivity losses to 6.4 percent of total output. Even under conservative assumptions, Freetown is expected to grow significantly over the next thirty years, with projected losses from labor productivity alone quintupling to almost USD 150 million (USD 147.4 million / SLL 1.8 trillion) in a typical year around 2050.
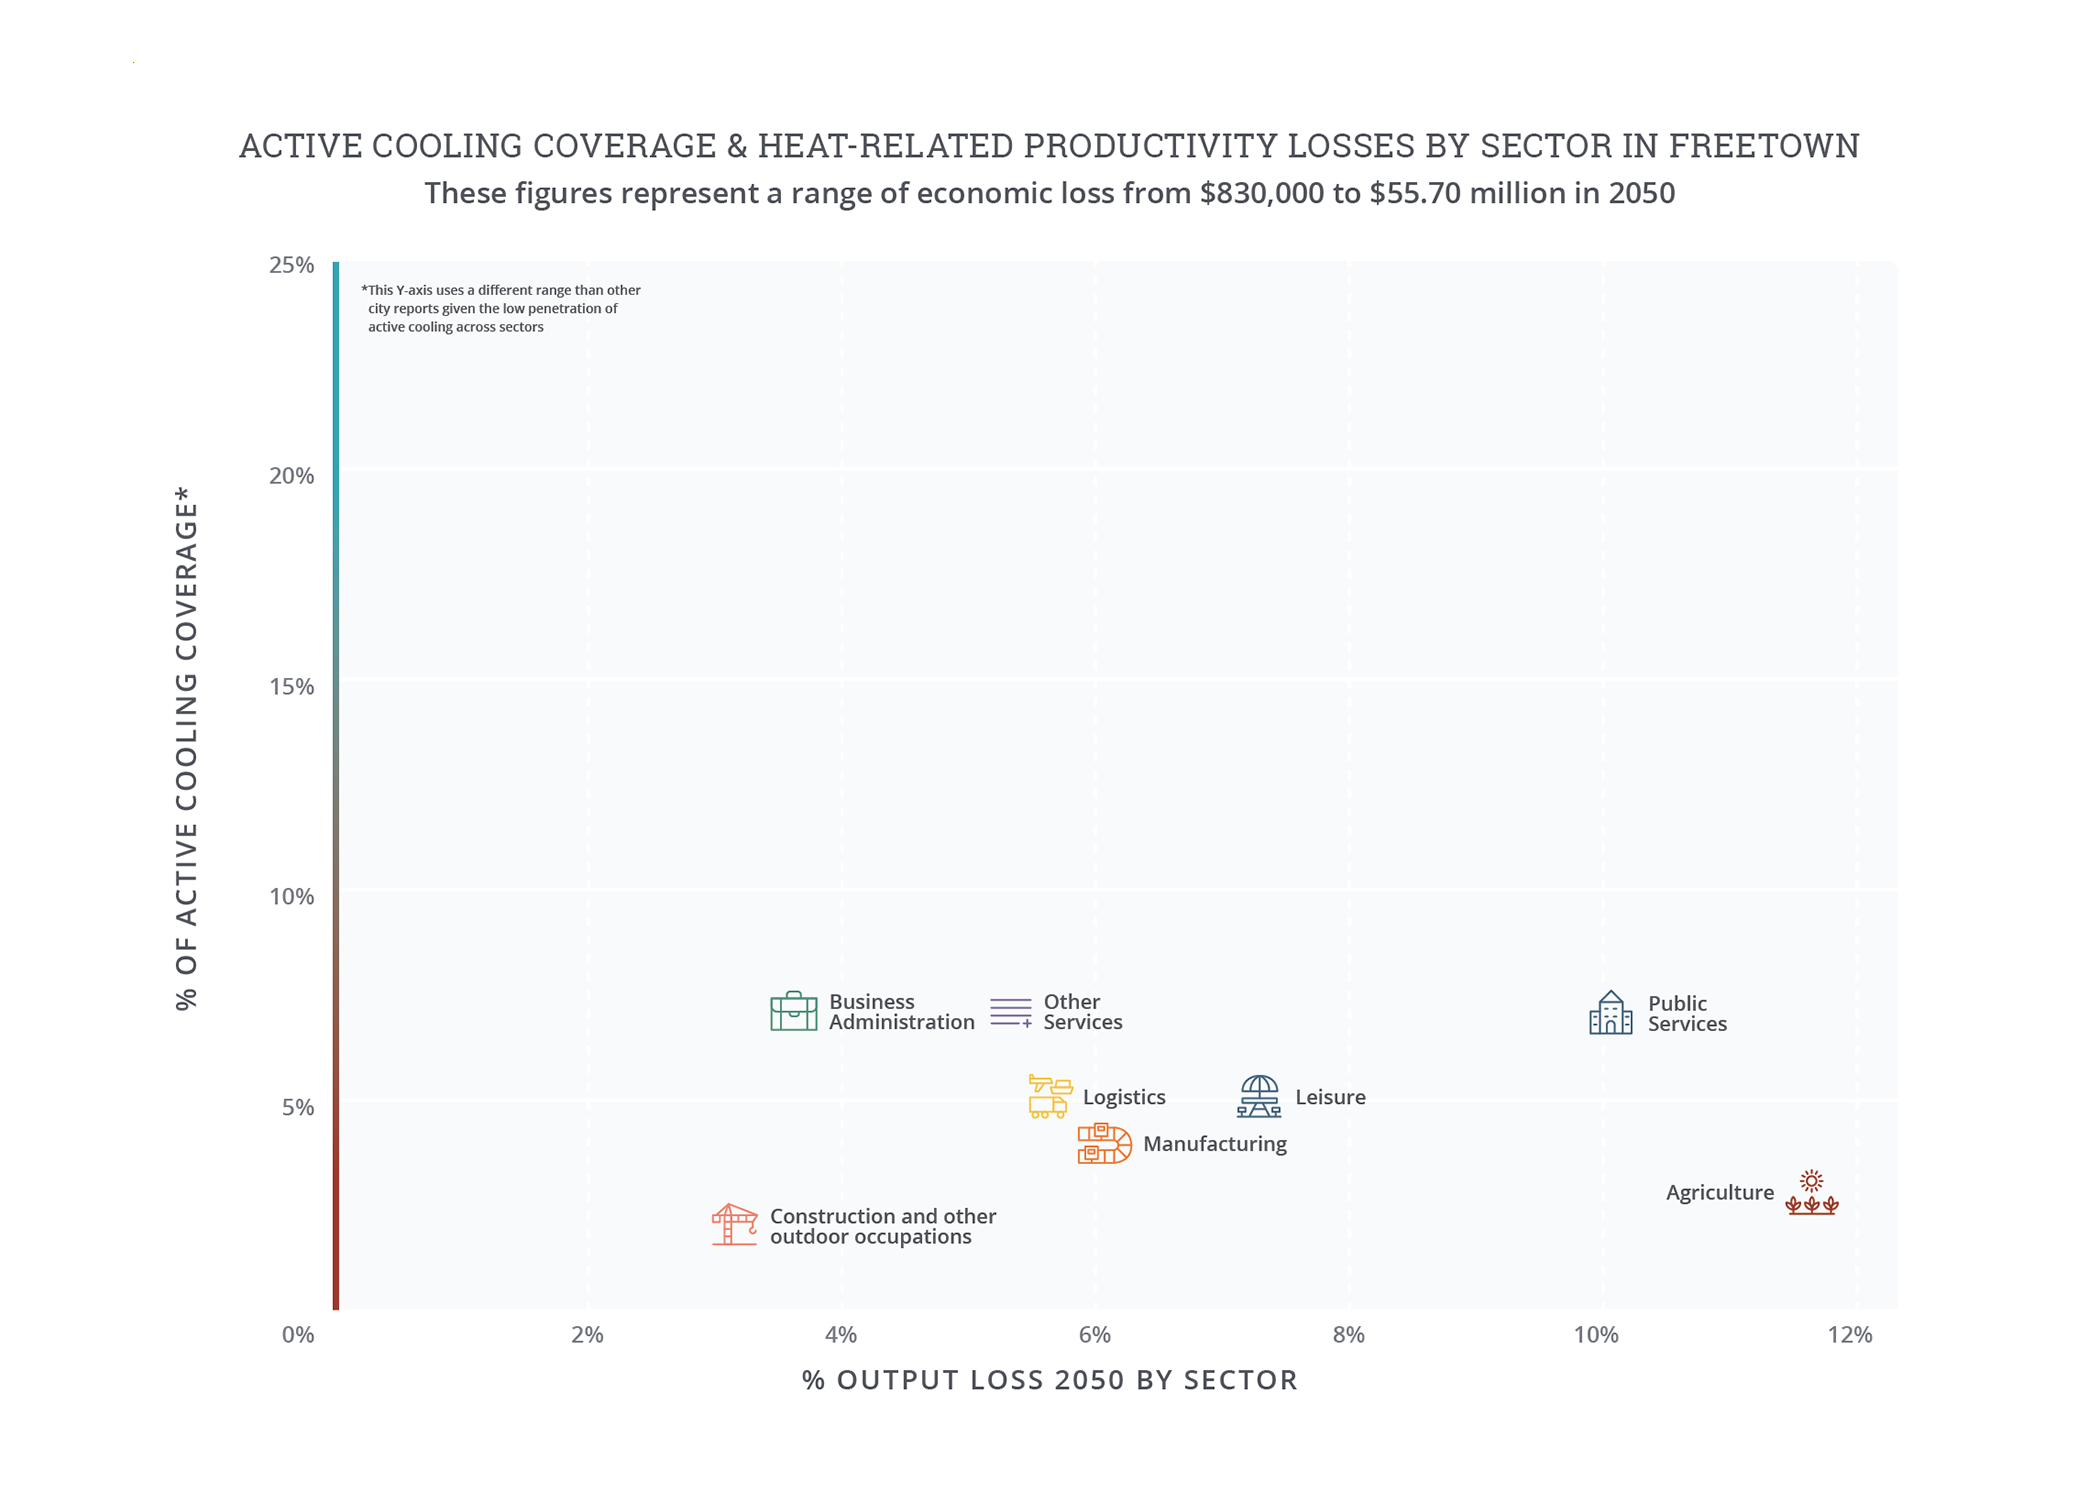
Freetown’s economy is particularly vulnerable to the effects of extreme heat and humidity as it relies on labor-intensive production, with more than 90 percent of working hours exposed to heat. While active cooling, such as air-conditioning (AC), can produce additional greenhouse gas emissions if powered by fossil fuel energy sources, it also provides strong protection from heat. Freetown’s relatively low AC penetration means that labor productivity impacts are felt across all sectors, and the degree of losses is differentiated primarily by the labor intensity of the work and the physical effort required. Wholesale and retail trade accounts for 38 percent of economic output in Freetown and approximately one-third of the heat-related losses. These sectors are also likely to account for a large proportion of informal employment, much of which takes place outside, fully exposed to heat, and the insecure nature of informal work lowers people’s capacity to adapt.11 As much of the city’s population survives on low incomes, this lost value has disproportionate impacts on individuals’ well-being and ability to escape poverty. The impact of heat- and humidity-related productivity losses is understated in this analysis, as the quantified lower outputs and resulting lower incomes from direct heat exposure also translate to lower spending and thus lower overall economic growth across all sectors.
Public services generate approximately 20 percent of economic value added but account for over 30 percent of heat-related labor productivity losses. In public services, workers generate the majority of economic value, so output in this sector is more vulnerable to heat and humidity than more capital-intensive sectors like trade. This heavy reliance on workers means that output is harder hit, despite work being less active and benefiting from some limited indoor cooling. Public-sector losses in the baseline economy are valued at USD 9 million (SLL 113 billion), and without further adaptation may rise to USD 45 million (SLL 562 billion) by 2050.


Note on “Projected number of hot and extremely hot days”: Days where the twenty-four hour average (i.e., daily) temperature exceeds the local 90th percentile of the baseline average daily temperature are defined as “hot days,” while days where the daily temperature exceeds the local 97.5th percentile are defined as “extreme hot days.” Because hot days are relative to typical local temperatures, the same daily temperature may be considered “hot” in one city but not another. The baseline is based on historical climate data, 1985-2005, while 2050 is based on the 2040-2060 climate projection from an ensemble of CMIP6 models under RCP 7.0. Source: Vivid Economics.
Note on “Productivity losses by sector”: The agricultural sector captures loss within the defined city limits and does not account for agricultural loss from the surrounding rural areas. Baseline losses are based on historical climate data from 1985-2005 and economic data from 2019. 2050 losses are based on the 2040-2060 climate projection from an ensemble of CMIP6 models under RCP 7.0 and economic models under SSP3. Losses assume no change in sectoral composition of economy.
Source: Vivid Economics.
Note on “Active cooling coverage and heat related productivity losses by sector”: The Y-axis uses a different range than other city reports given the low penetration of active cooling across sectors. O*NET, 2021; and analysis by Vivid Economics.
Extreme heat interventions
More than any other city in this study, Freetown faces the dual challenges of socioeconomic development and adaptation. Rather than regarding these as competing challenges, Freetown can take an integrated approach, making climate-proof investments to secure its future economy. The city is already undertaking some innovative measures to adapt to the increasing heat, under the direction of a Chief Heat Officer.
- Planning/policy: Overall development plans to improve housing and the availability of clean water18 will offer additional heat resilience premiums, as access to water is an essential tool to combat heat—both for hydration and through evaporative cooling in less humid weather.
- Investment in the built environment and nature-based solutions: Building on the proven efficacy of trees at reducing heat stress, the Freetown the Treetown project has leveraged social media, mobile payment technology, and machine learning to promote greater community ownership and engagement in reforestation and urban afforestation.19 The program not only reduces heat stress but also provides jobs within the community, particularly for marginalized women and young people. The challenge of overheating in Freetown’s markets is also being addressed by installing cooling shades to provide protection from the sun.
Explore more city chapters
Return to the global summary
Endnotes
1 To estimate economic losses, this study goes beyond political boundaries to give a sense of how extreme heat and humidity impact Freetown’s influence area. Core economic modeling considers the Western District Urban, including 90 counties. The regional approach is to ensure that analysis covers populations that are central to Freetown’s growth and urban trajectory.
2 All analysis is based on RCP 7.0 and SSP3 using an ensemble mean of CMIP6 models; see accompanying methodology document for details.
3 Analysis by Vivid Economics, based on summer average land surface temperature (LST), modeled climate data in 2050, and analysis of expected UHI and urban development from Kangning Huang et al., “Projecting Global Urban Land Expansion and Heat Island Intensification through 2050,” Environmental Research Letters 14, no. 11, 2019, https://iopscience.iop.org/article/10.1088/1748-9326/ab4b71.
4 “Sierra Leone,” Global Forest Watch (online dashboard), Deforestation Rates and Statistics, accessed September 2022, https://www.globalforestwatch.org/dashboards/country/SLE/.
5 “Transforming Sierra Leone’s Capital,” United Nations Environment Programme (website), August 19, 2020, https://www.unep.org/news-and-stories/story/transforming-sierra-leones-capital.
6 Michael A. O. Johnson, “An Assessment of the Urban Conditions and Systemic Issues Contributing to Slum Development in Freetown, Sierra Leone,” Working Paper, 2009, accessed via Sierra Leone Urban Research Centre (SLURC), https://www.slurc.org/uploads/1/0/9/7/109761391/an_assessment_of_the_urban_conditions_and_systematic_issues.pdf.
7 R. L. Wilby et al., “Monitoring and Moderating Extreme Indoor Temperatures in Low-Income Urban Communities,” Environmental Research Letters 16, no. 2 (2021): 024033, doi:10.1088/1748-9326/abdbf2.
8 The workability analysis is based on climate factors and not indoor working conditions determined by built environment characteristics or workplace layout (e.g., equipment that generates heat, body heat in close spaces, ventilation or greenhouse effects from windows, external shading). In practice, some of these factors can make indoor environments hotter than the modeled climate conditions suggest.
9 Economic data in this report are from 2019 to avoid capturing the effect of COVID-19 on the economies of the cities analyzed; see methodology for further details.
10 Numbers are approximate and rounded to the nearest 10. Exchange rates from International Monetary Fund (2022). 2021 annual average exchange rate – 12500 SLL/USD. Available at https://data.imf.org/regular.aspx?key=61545850.
11 Braima Koroma et al., Urban Livelihoods in Freetown’s Informal Settlements, SLURC, 2017, https://www.slurc.org/uploads/1/0/9/7/109761391/slurc_urban_livelihoods_report_web_quality.pdf.
12 “Sierra Leone: Trade Facilitation Improvements Are Starting to Bear Fruit,” World Bank (website), July 18, 2019, https://www.worldbank.org/en/news/feature/2019/07/18/sierra-leone-trade-facilitation-improvements-are-starting-to-bear-fruit.
13 Sierra Leone Country Profile, Observatory of Economic Complexity (platform), accessed September 2022, https://oec.world/en/profile/country/sle#.
14 Netherlands Enterprise Agency, Sector Scan Logistics in Sierra Leone, July 2018, ; and “Port of Freetown Expansion: Sierra Leone Is on Growth Path,” Logistics Update Africa (website), March 28, 2022, https://www.logupdateafrica.com/shipping/port-of-freetown-expansion-sierra-leone-is-on-growth-path-1344929.
15 “Gaussin’s Equipment to Enhance Sierra Leone’s Box Terminal,” Container News, October 19, 2021, https://container-news.com/gaussins-equipment-to-enhance-sierra-leones-box-terminal/.
16 “Technical Inquiry: Can We Have Your Feedback on Thermal Comfort in Hot Weather: Are Ports Permitting the Wearing of Shorts for Cargo Handling Work?,” International Cargo Handling Coordination Association, July 2021, https://www.portskillsandsafety.co.uk/files/2021-08/ICHCA%20-%20Technical%20Enquiry%20-%20Thermal%20Comfort%20in%20hot%20weather.pdf.
17 Nectar Sierra Leone Bulk Terminal (NSBT) Environmental and Social Health Impact Assessment (ESHIA) Review Study, Banque Publique d’Investissement (a.k.a. Bpifrance), 2022, https://www.bpifrance.fr/sites/default/files/2022-01/NSBT%20Environmental%20Social%20Health%20Imapct%20Study.pdf.
18 Freetown City Council, Transform Freetown: An Overview 2019-2022, 2019, https://fcc.gov.sl/wp-content/uploads/2019/01/Transform-Freetown-an-overview.pdf; and Freetown City Council, Transform Freetown: Second Year Report January 2020-January 2021, 2021, https://fcc.gov.sl/transform-freetown-second-year-report-2020-2021/.
19 Nick Jones et al., “Mapping Dar es Salaam’s Trees through Artificial Intelligence,” World Bank (blog), May 18, 2022, https://blogs.worldbank.org/digital-development/mapping-dar-es-salaams-trees-through-artificial-intelligence; and Tiguist Fisseha et al., “#FreetownTheTreeTown Campaign: Using Digital Tools to Encourage Tree Cultivation in Cities,” World Bank (blog), July 20, 2021, https://blogs.worldbank.org/sustainablecities/freetownthetreetown-campaign-using-digital-tools-encourage-tree-cultivation.
