Overview
London’s generally mild climate means it is unprepared for episodes of high heat, which are happening with increasing frequency.
Temperatures on poorly ventilated lines of the London Underground, for example, often exceed legal limits for transporting cattle (30°C). In July 2022, London reached temperatures above 40°C, the hottest ever recorded.
While London’s extensive parks help to mitigate the effects of heat, limited shading and trees on streets in some lower-income neighborhoods mean these areas are disproportionately exposed. The lowest average tree canopy cover in London (13 percent) is in boroughs such as Barking and Dagenham and Newham, which also have among the lowest average household income.
Due to heat, London’s professional sector loses $425 million (£336 million) from reduced worker productivity in office environments each year. Extreme events will likely cause additional significant losses.
Losses from labor productivity alone are already significant, at 0.2 percent of output in 2019, and would be higher when other effects are considered—for example, through heat-related transportation failures that prohibit workers from commuting.
Even with its moderate climate, London’s population is exposed to high discomfort, overheating homes, and—in extreme cases of heat or vulnerability—heat-related mortality.
London has developed effective heat awareness measures, but as conditions of extreme heat become more frequent, further long-term investments in the building and infrastructure stock will be required. Housing retrofits have focused on insulation to keep homes warm in winter, so without air-conditioning or good passive cooling practices homes can overheat significantly in the summer.
Extreme heat conditions
London’s1 generally mild climate means it is unprepared for episodes of high heat, which are happening with increasing frequency. In a typical year, the hottest ten days face average temperatures across a twenty-four hour period that exceed approximately 20°C,2 a temperature at which the productivity and health impacts are typically small, and lower overnight temperatures help people to recover from higher peak temperatures during the day. However, the city’s infrastructure is ill-adapted to even these typical temperatures: for example, heat already causes delay and discomfort on the poorly ventilated Underground network, as train tracks expand, and temperatures exceed legal limits for transporting cattle. Recent heat waves have seen temperatures above 40 degrees Celsius, resulting in a wave of service closures and households rushing to adapt. Without action to reduce emissions, current extremes will become twice as frequent.
While London’s parks mitigate the effects of heat, limited shading and trees on streets in some lower-income neighborhoods mean these areas are disproportionately exposed. The lower-income boroughs of Newham and Barking and Dagenham have the lowest tree canopy cover, at only 13 percent in contrast to an average of around 20 percent, and above 25 percent in some areas. The urban heat island (UHI) effect in London is less intense than many other cities in this study but is widespread across the city’s footprint. In the 1985–2005 baseline climate, the average temperature differential is approximately 3 degrees Celsius warmer in London compared to the surrounding countryside.3 While some hot spots reach differentials of up to 9 degrees Celsius, these areas are limited and scattered across the city. Climate change is expected to raise temperatures relatively uniformly across London, although some poorer, built-up areas of East London are projected to experience greater UHI effects.
Impacts of heat
Despite London’s mild climate and predominantly indoor workforce, lost output from heat- and humidity-related reductions to labor productivity is already significant. Losses in a typical year around 20204 are valued at USD 730 million (GBP 577 million), or 0.9 percent of output in a typical year, one thousand times more than public spending on tree planting in the city. Without action to reduce emissions or adapt to rising temperatures, the value of labor productivity losses is projected to mount to USD 840 million (GBP 664 million).
This may be compounded significantly by further impacts, for example, such as indirect effects as worker productivity losses and associated reduced incomes affect overall demand, or through heat-related transportation failures that prohibit workers from commuting. In London’s July 2022 heat wave, nearly all of its rail transit was subject to delays or cancellation, and flights were grounded at Luton Airport as heat dangerously damaged runways.
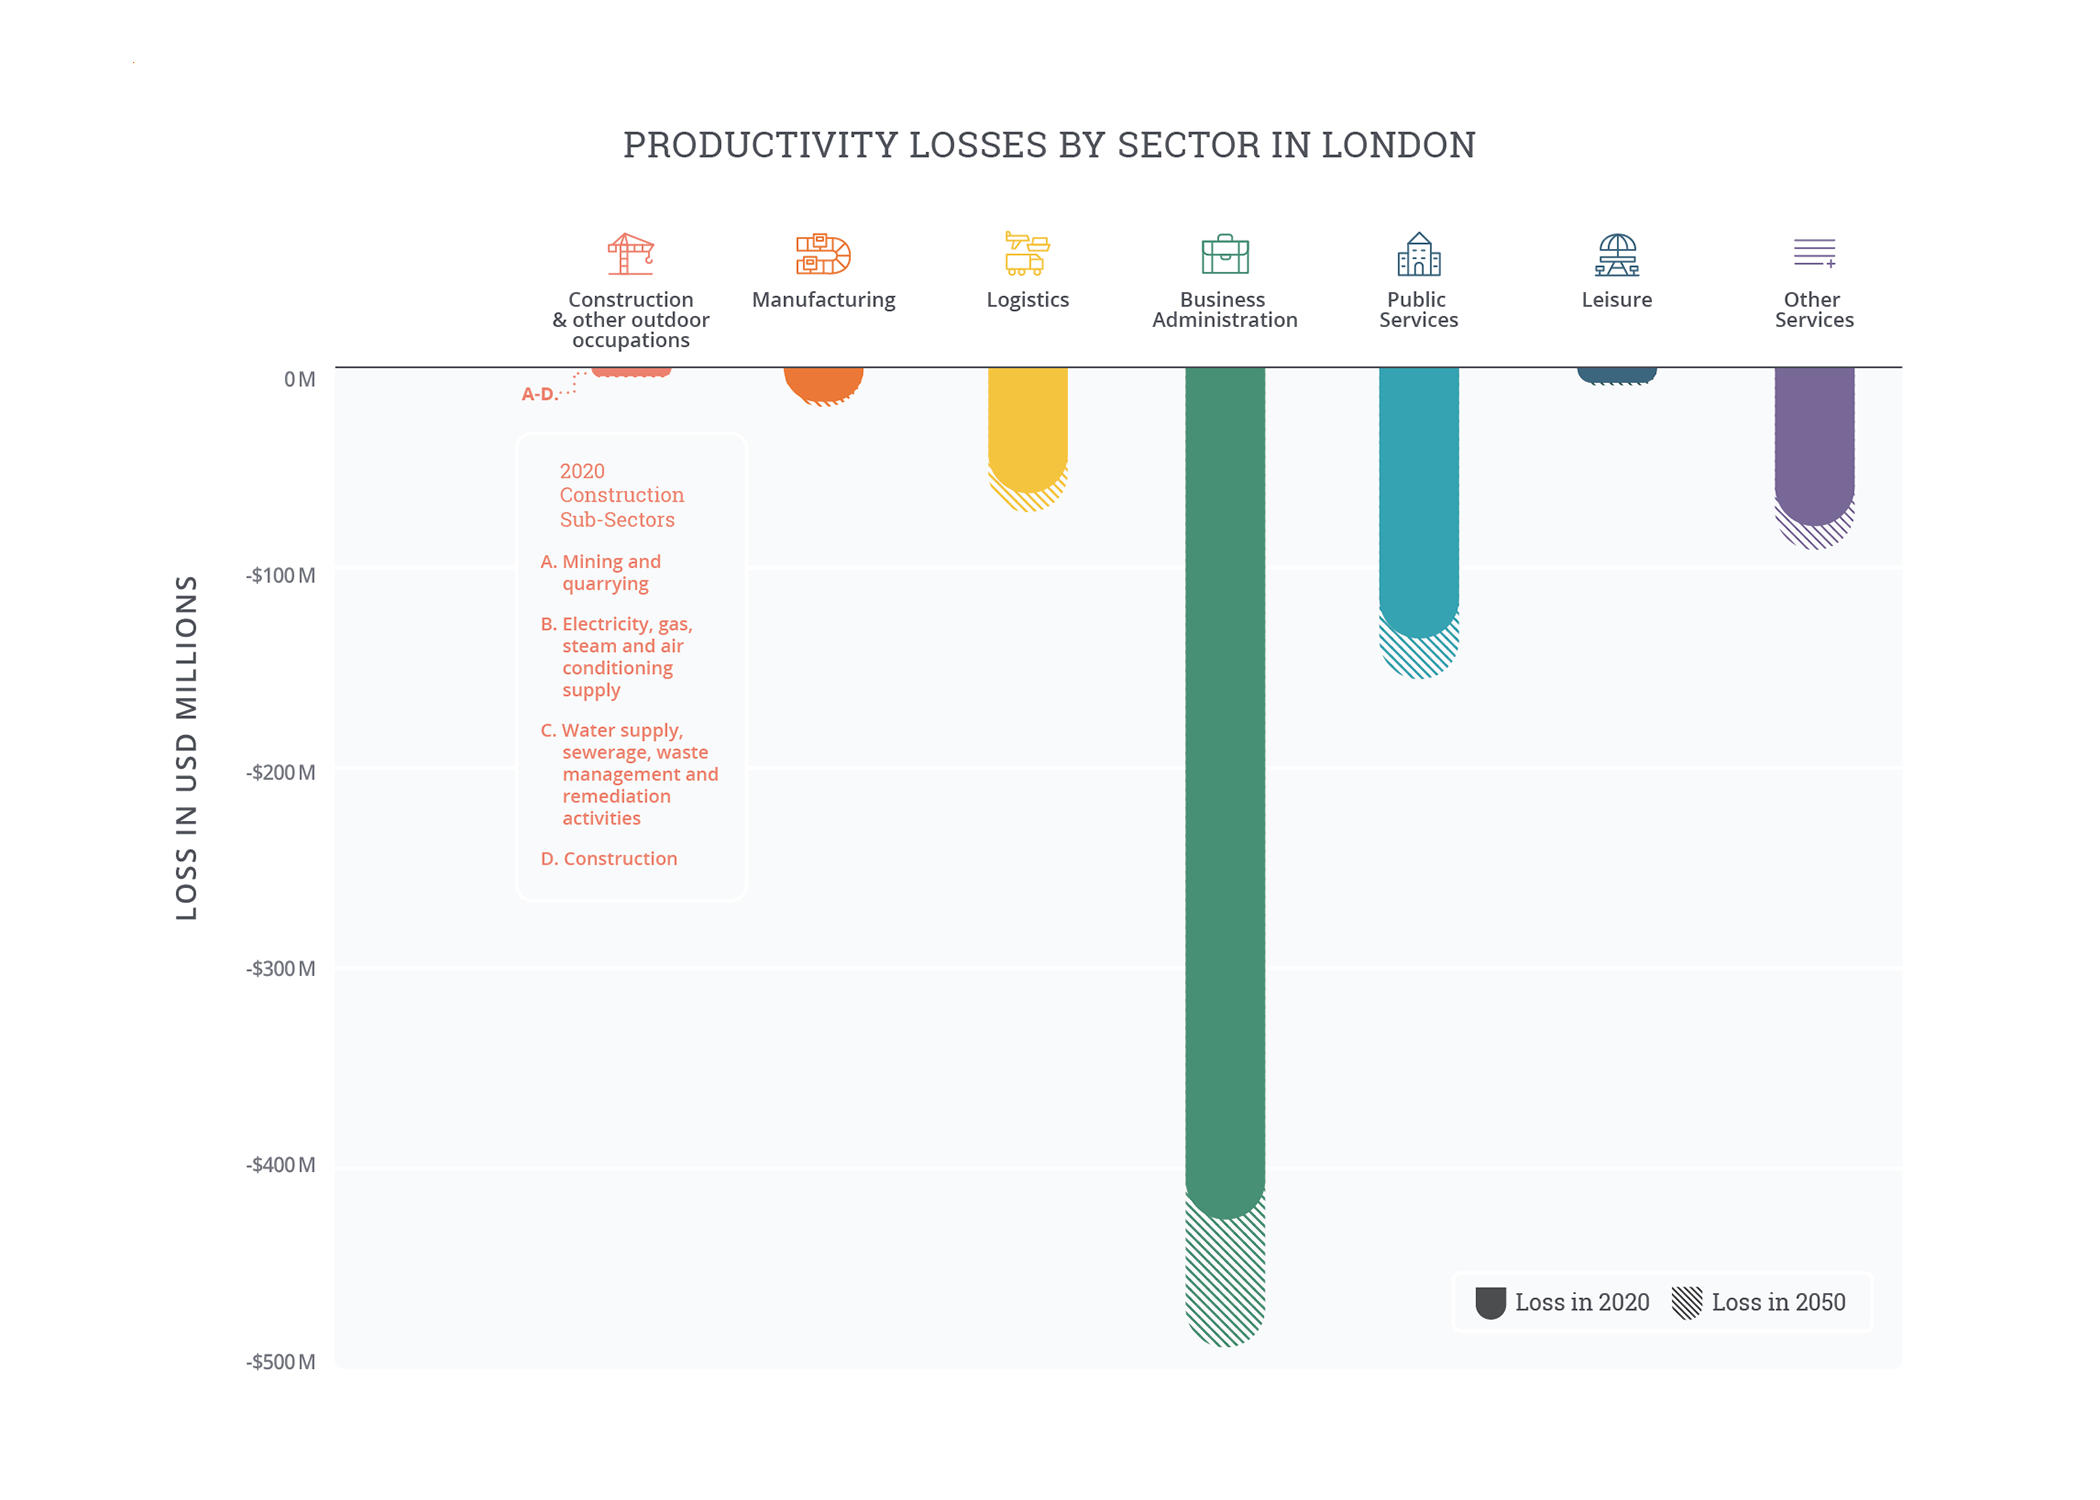
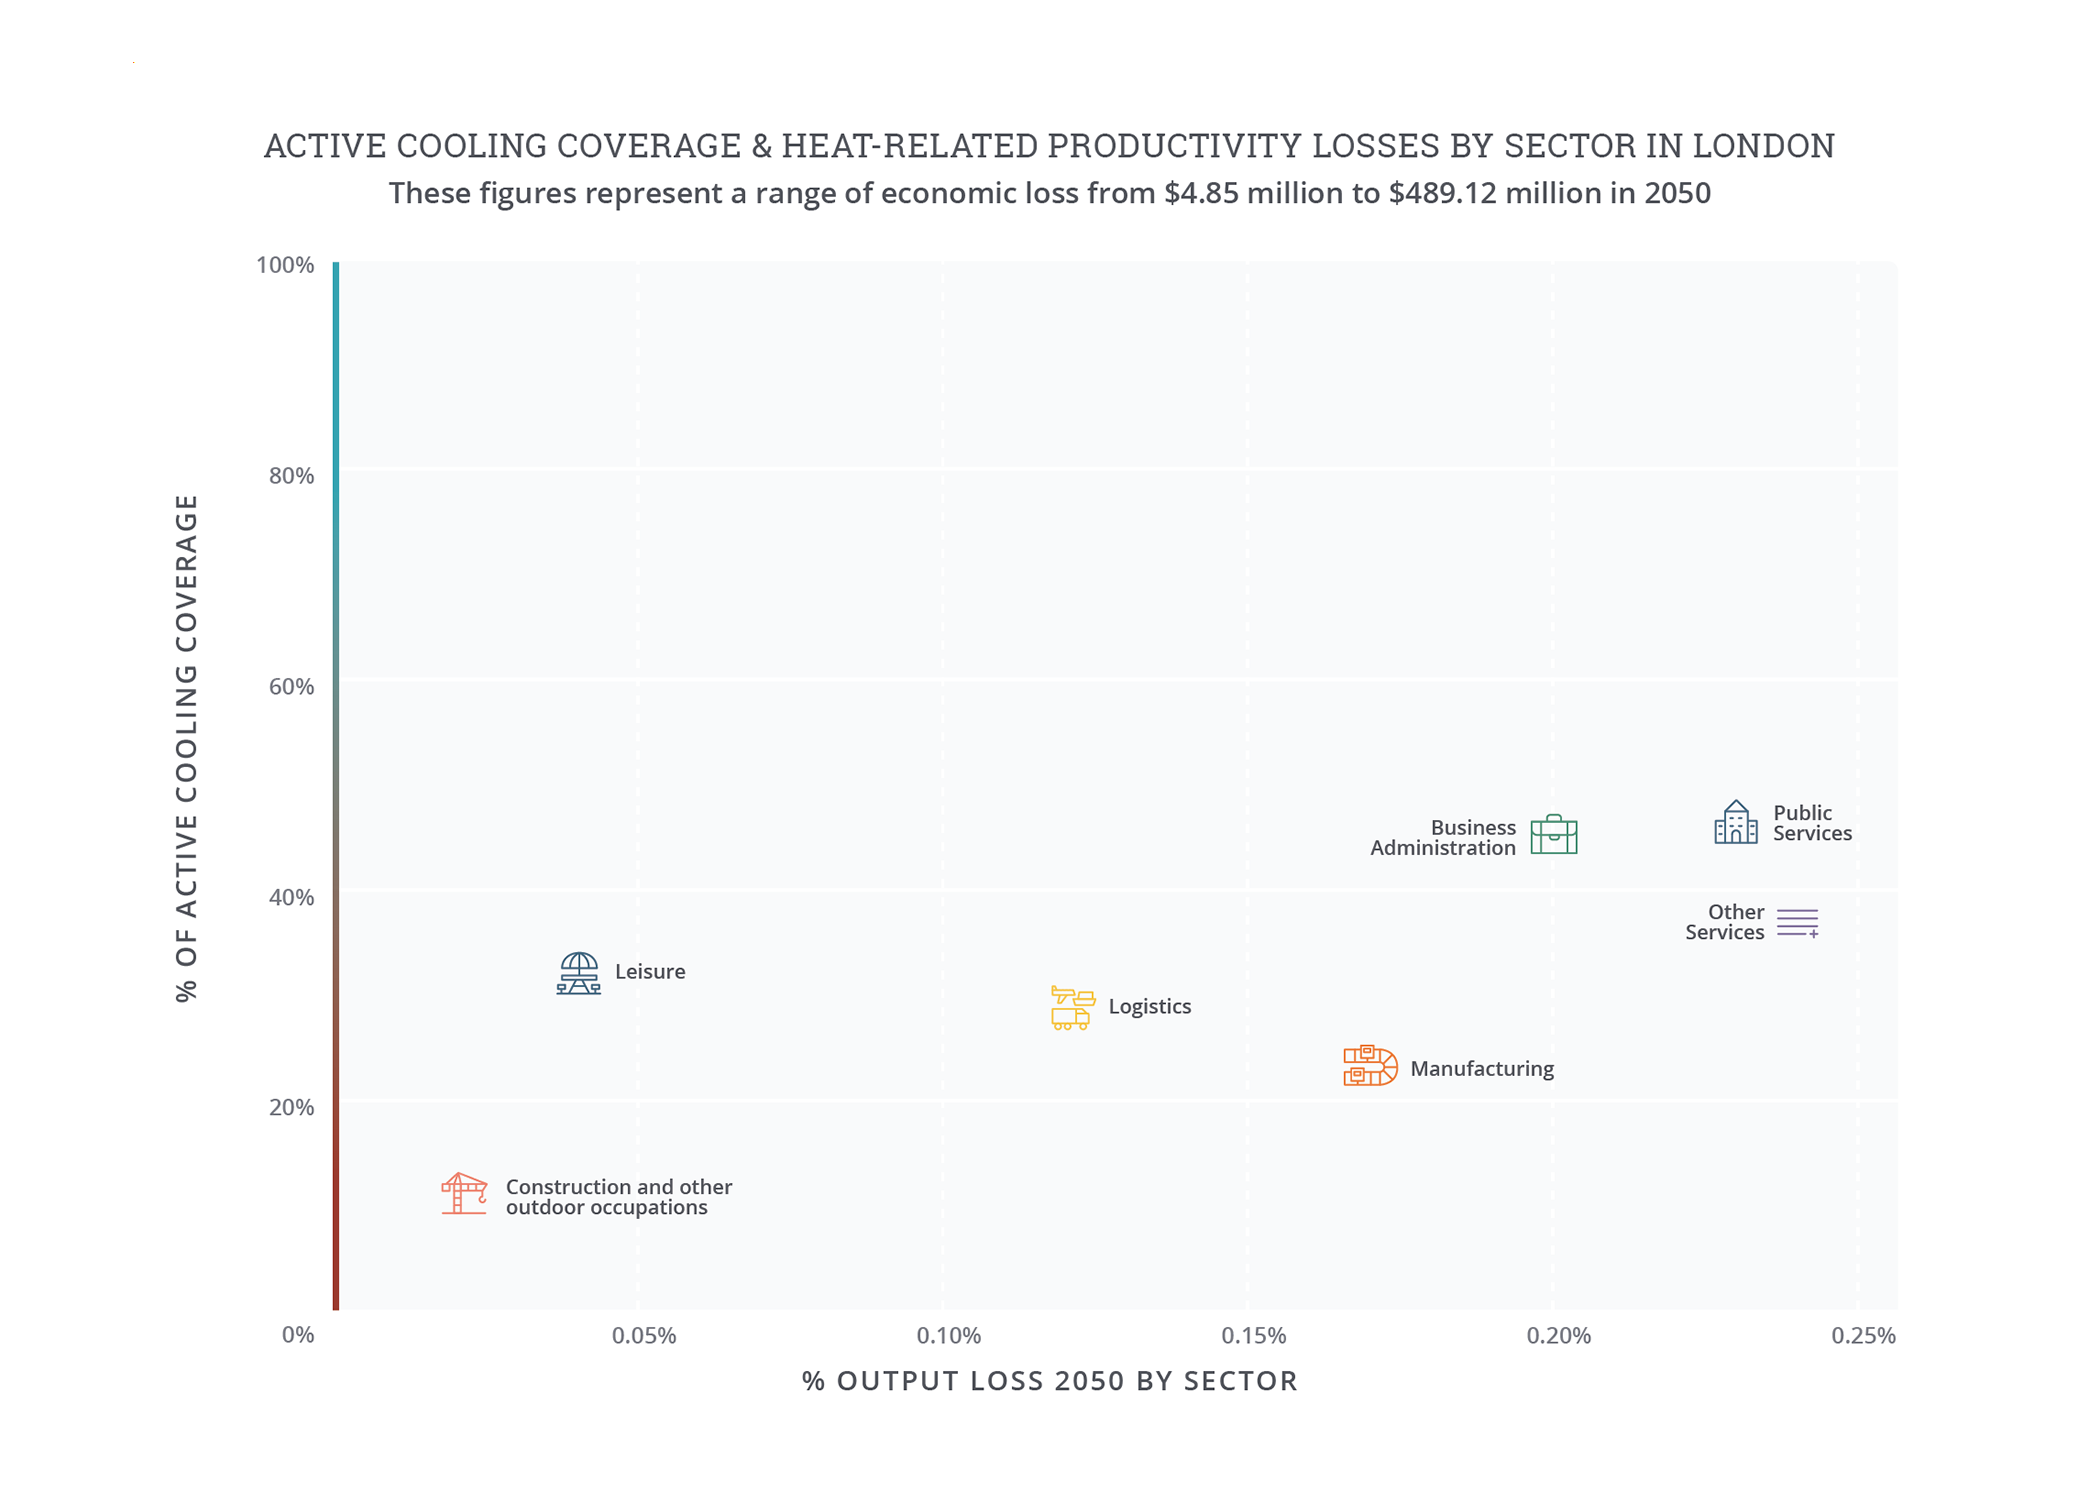
The service-oriented economy of London means that there is limited variation in labor productivity losses between sectors, with a sector’s total output being the main indicator of the scale of its losses. Business administration generates more than half of the economic output in London, and accounts for a proportionate 58 percent of potential output lost. These workers, in finance, insurance, communications, science, and other professional subsectors, spend almost half of their time in air-conditioned environments.
In London’s July 2022 heat wave, nearly all of its rail transit was subject to delays or cancellation, and flights were grounded as heat damaged runways.
The work that does not take place in air-conditioning is largely sedentary and therefore not as vulnerable to the physical mechanisms that drive heat-related productivity losses. Nonetheless, losses in this subsector reach USD 425 million (GBP 336 million). Increasing temperatures and moderate gross domestic product growth may drive that loss to USD 490 million (GBP 388 million) by 2050.
Even with its moderate climate, London’s population is exposed to high discomfort, overheating homes, and—in extreme cases of heat or vulnerability—heat-related mortality. This vulnerability is disproportionately felt not only by the elderly in general but also individuals in lower quality housing, those without access to indoor cooling, and those who spend significant time in the home—namely, the elderly, infirm, and unemployed. Modeling suggests that daytime occupied homes overheat 50 percent more often than empty homes, and that top floor, 1960s era flats overheat more often than other forms of housing. Mid-century flats represent the majority of social housing in England, meaning the economically disadvantaged are more exposed to the effects of residential overheating.
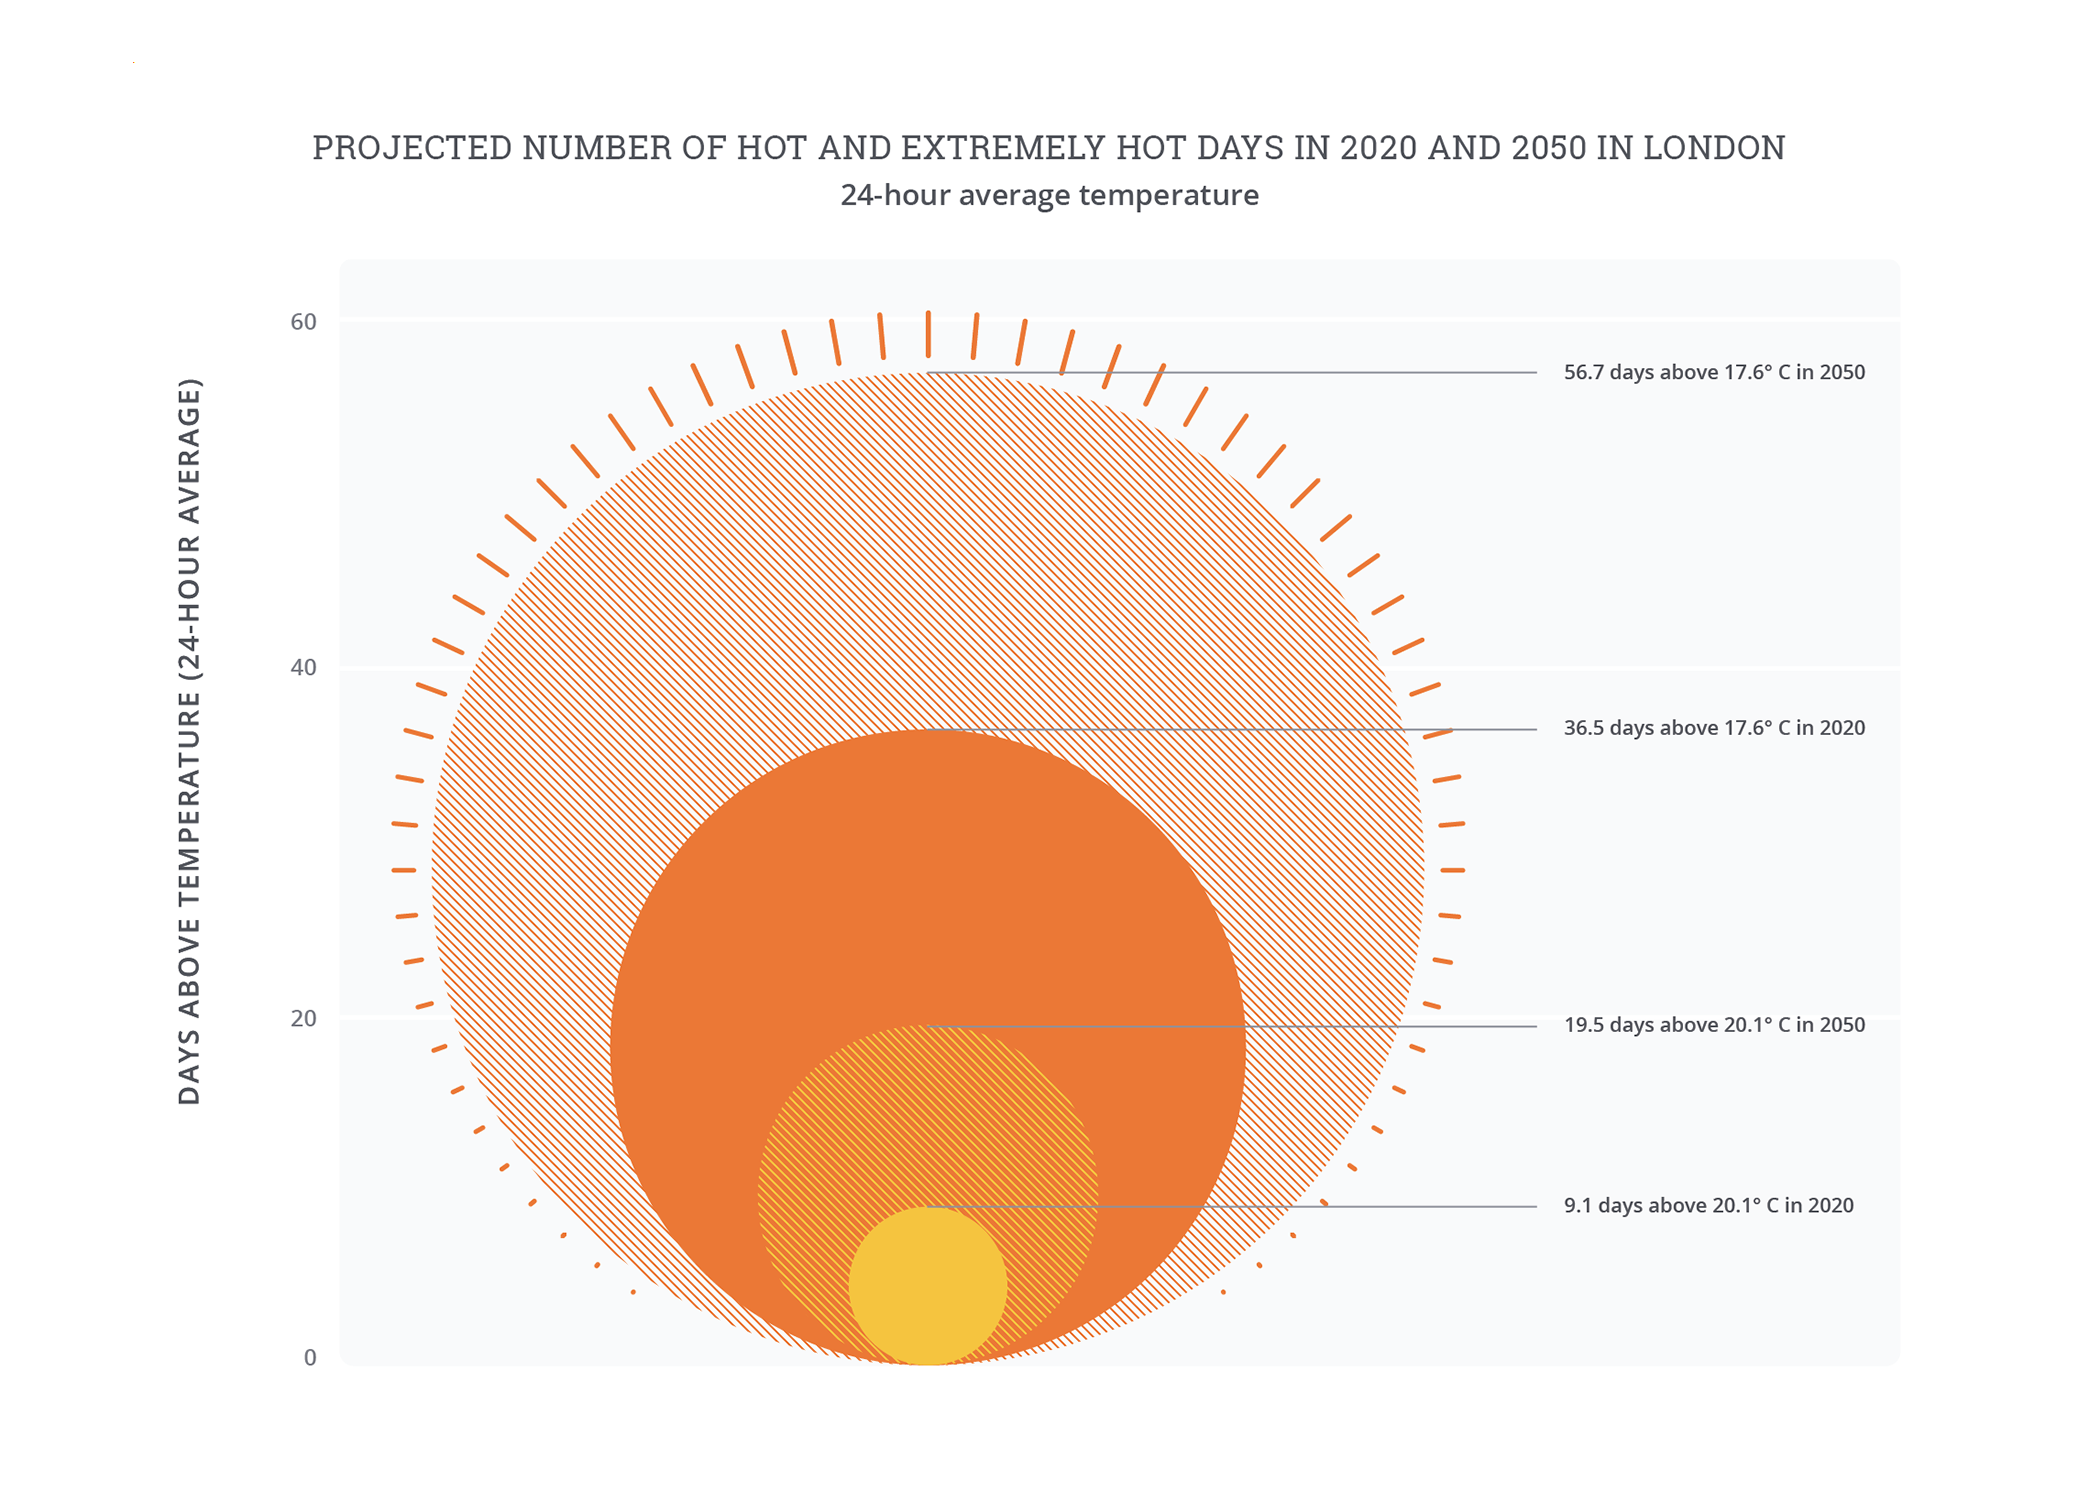
Note on “Projected number of hot and extremely hot days”: Days where the twenty-four hour average (i.e., daily) temperature exceeds the local 90th percentile of the baseline average daily temperature are defined as “hot days,” while days where the daily temperature exceeds the local 97.5th percentile are defined as “extreme hot days.” Because hot days are relative to typical local temperatures, the same daily temperature may be considered “hot” in one city but not another. The baseline is based on historical climate data, 1985-2005, while 2050 is based on the 2040-2060 climate projection from an ensemble of CMIP6 models under RCP 7.0.
Note on “Productivity losses by sector”: The agricultural sector captures loss within the defined city limits and does not account for agricultural loss from the surrounding rural areas. Baseline losses are based on historical climate data from 1985-2005 and economic data from 2019. 2050 losses are based on the 2040-2060 climate projection from an ensemble of CMIP6 models under RCP 7.0 and economic models under SSP3. Losses assume no change in sectoral composition of economy. Source: Vivid Economics.
Note on “Active cooling coverage and heat related productivity losses by sector”: O*NET, 2021; and analysis by Vivid Economics.
Extreme heat interventions
London has developed effective heat awareness measures, but as conditions of extreme heat become more frequent these effects can be bolstered with long-term investments in buildings and infrastructure.
- Planning/policy: A 2015 report highlighted a range of policy and regulatory measures that could improve residential overheating in London. Though there are laws in place governing minimum workplace temperatures, there is no protection from hot working conditions other than guidance that temperatures must be “reasonable.”
- Communications/outreach: The UK Met Office monitors heat between June 1 and September 15 and issues heat-health warnings nationwide when temperatures exceed 30 degrees Celsius by day and 15 degrees Celsius overnight for at least two consecutive days. During the summer heat season, London runs a “Cool Spaces” scheme, providing an interactive map listing public places to find relief from the heat across the city. Transport for London (TfL) has long operated a “Beat the Heat” campaign that involves informational campaigns about how to stay safe in high temperatures. During heat waves, many media sources run stories on how to keep cool. Such stories may improve public awareness of simple adaptation strategies for people to keep themselves and their homes cool, like reducing indoor sources of heat and using windows and blinds effectively.
- Investment in the built environment and nature-based solutions: Retrofitting the built environment to make active indoor cooling more efficient and embedding passive cooling in new building design and orientation can contribute to reducing the indoor overheating problem. The city is also working to reduce heat exposure through tree-planting campaigns. The mayor has funded the planting of over 280,000 trees in London since 2016, and Londoners can contribute directly to the effort to make a more heat-resilient city through the national Trees for Streets program. TfL’s “Beat the Heat” program also provides investment in retrofitting buses and the Tube to reduce heat, but given annual headlines of soaring transport temperatures, these projects will need to scale up rapidly as the city’s transport lines are modernized.
Explore more city chapters
Return to the global summary

Endnotes
1 To estimate economic losses, this study goes beyond political boundaries to give a sense of how extreme heat and humidity impact London’s influence area. Core economic modeling considers Greater London Area. The regional approach is to ensure that analysis covers populations that are central to London’s growth and urban trajectory.
2 All analysis is based on RCP 7.0 and SSP3 using an ensemble mean of CMIP6 model, as discussed in greater detail in the accompanying methodology document; 20°C is the 97.5th percentile average daily temperature in London in the baseline climate.
3 The workability analysis is based on climate factors and not indoor working conditions determined by built environment characteristics or workplace layout (e.g., equipment that generates heat, body heat in close spaces, ventilation or greenhouse effects from windows, external shading). In practice, some of these factors can make indoor environments hotter than the modeled climate conditions suggest.
4 Economic data in this report are from 2019 to avoid capturing the effect of COVID-19 on the economies of the cities analyzed; see methodology for further details.