Overview
Los Angeles is no stranger to heat, as almost ten days a year experience an average temperature of 27°C (81°F) or higher, with peaks of up 45°C (113°F) in recent years.
Under current conditions, heat costs Los Angeles almost USD 5 billion in lost worker productivity in a typical year—nearly half of the city’s annual budget of USD 11.2 billion—and will rise to USD 11 billion annually by 2050.
Los Angeles1 is known for its urban sprawl and its confluence of major, multilane highways, whose exposed surfaces capture heat and intensify its impact on residents—leading to hotspots that can be as much as 18°C (32°F) hotter than rural surroundings.
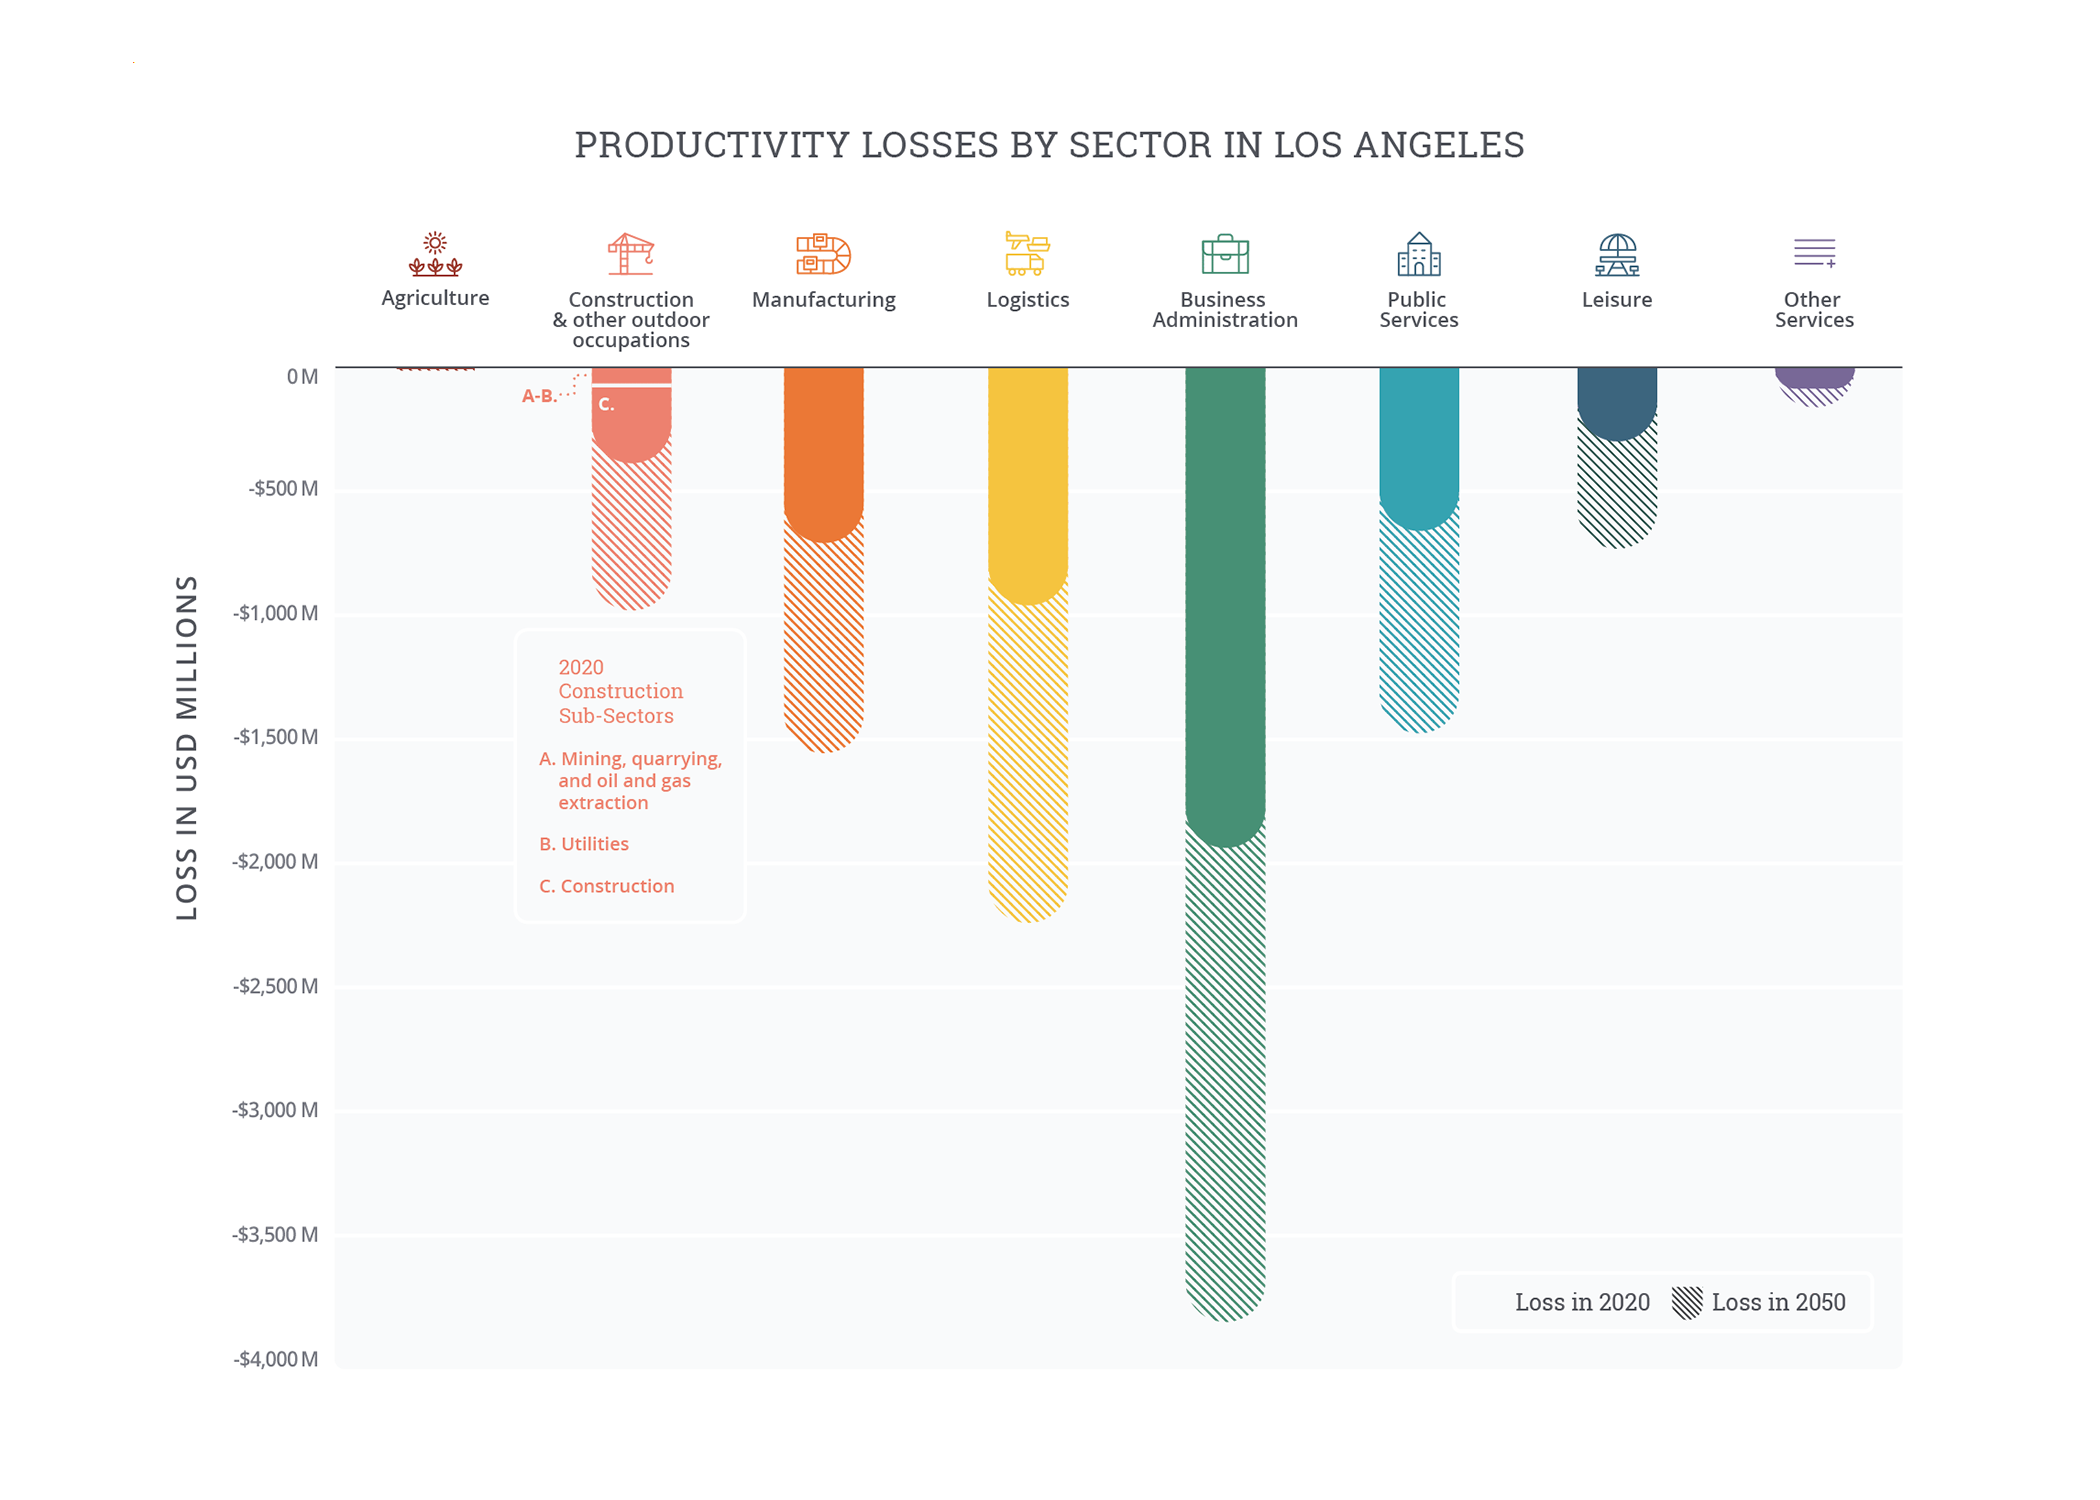
Every sector of the city’s economy is affected, with absolute losses concentrated in finance, insurance, and real estate, but with disproportionate impacts on construction workers.
The health impacts of heat in Los Angeles are expected to be concentrated among its elderly, low-income, ethnic minority, and homeless populations. The city also faces related hazards from wildfire and drought, which can both be triggered by and compound the physiological impacts of hot weather.
Ongoing adaptation efforts can mitigate the impact of heat on Los Angeles’s economy and population, but the city will need to follow through on its ambitious strategies to achieve real impact for its most vulnerable populations.
Extreme heat conditions
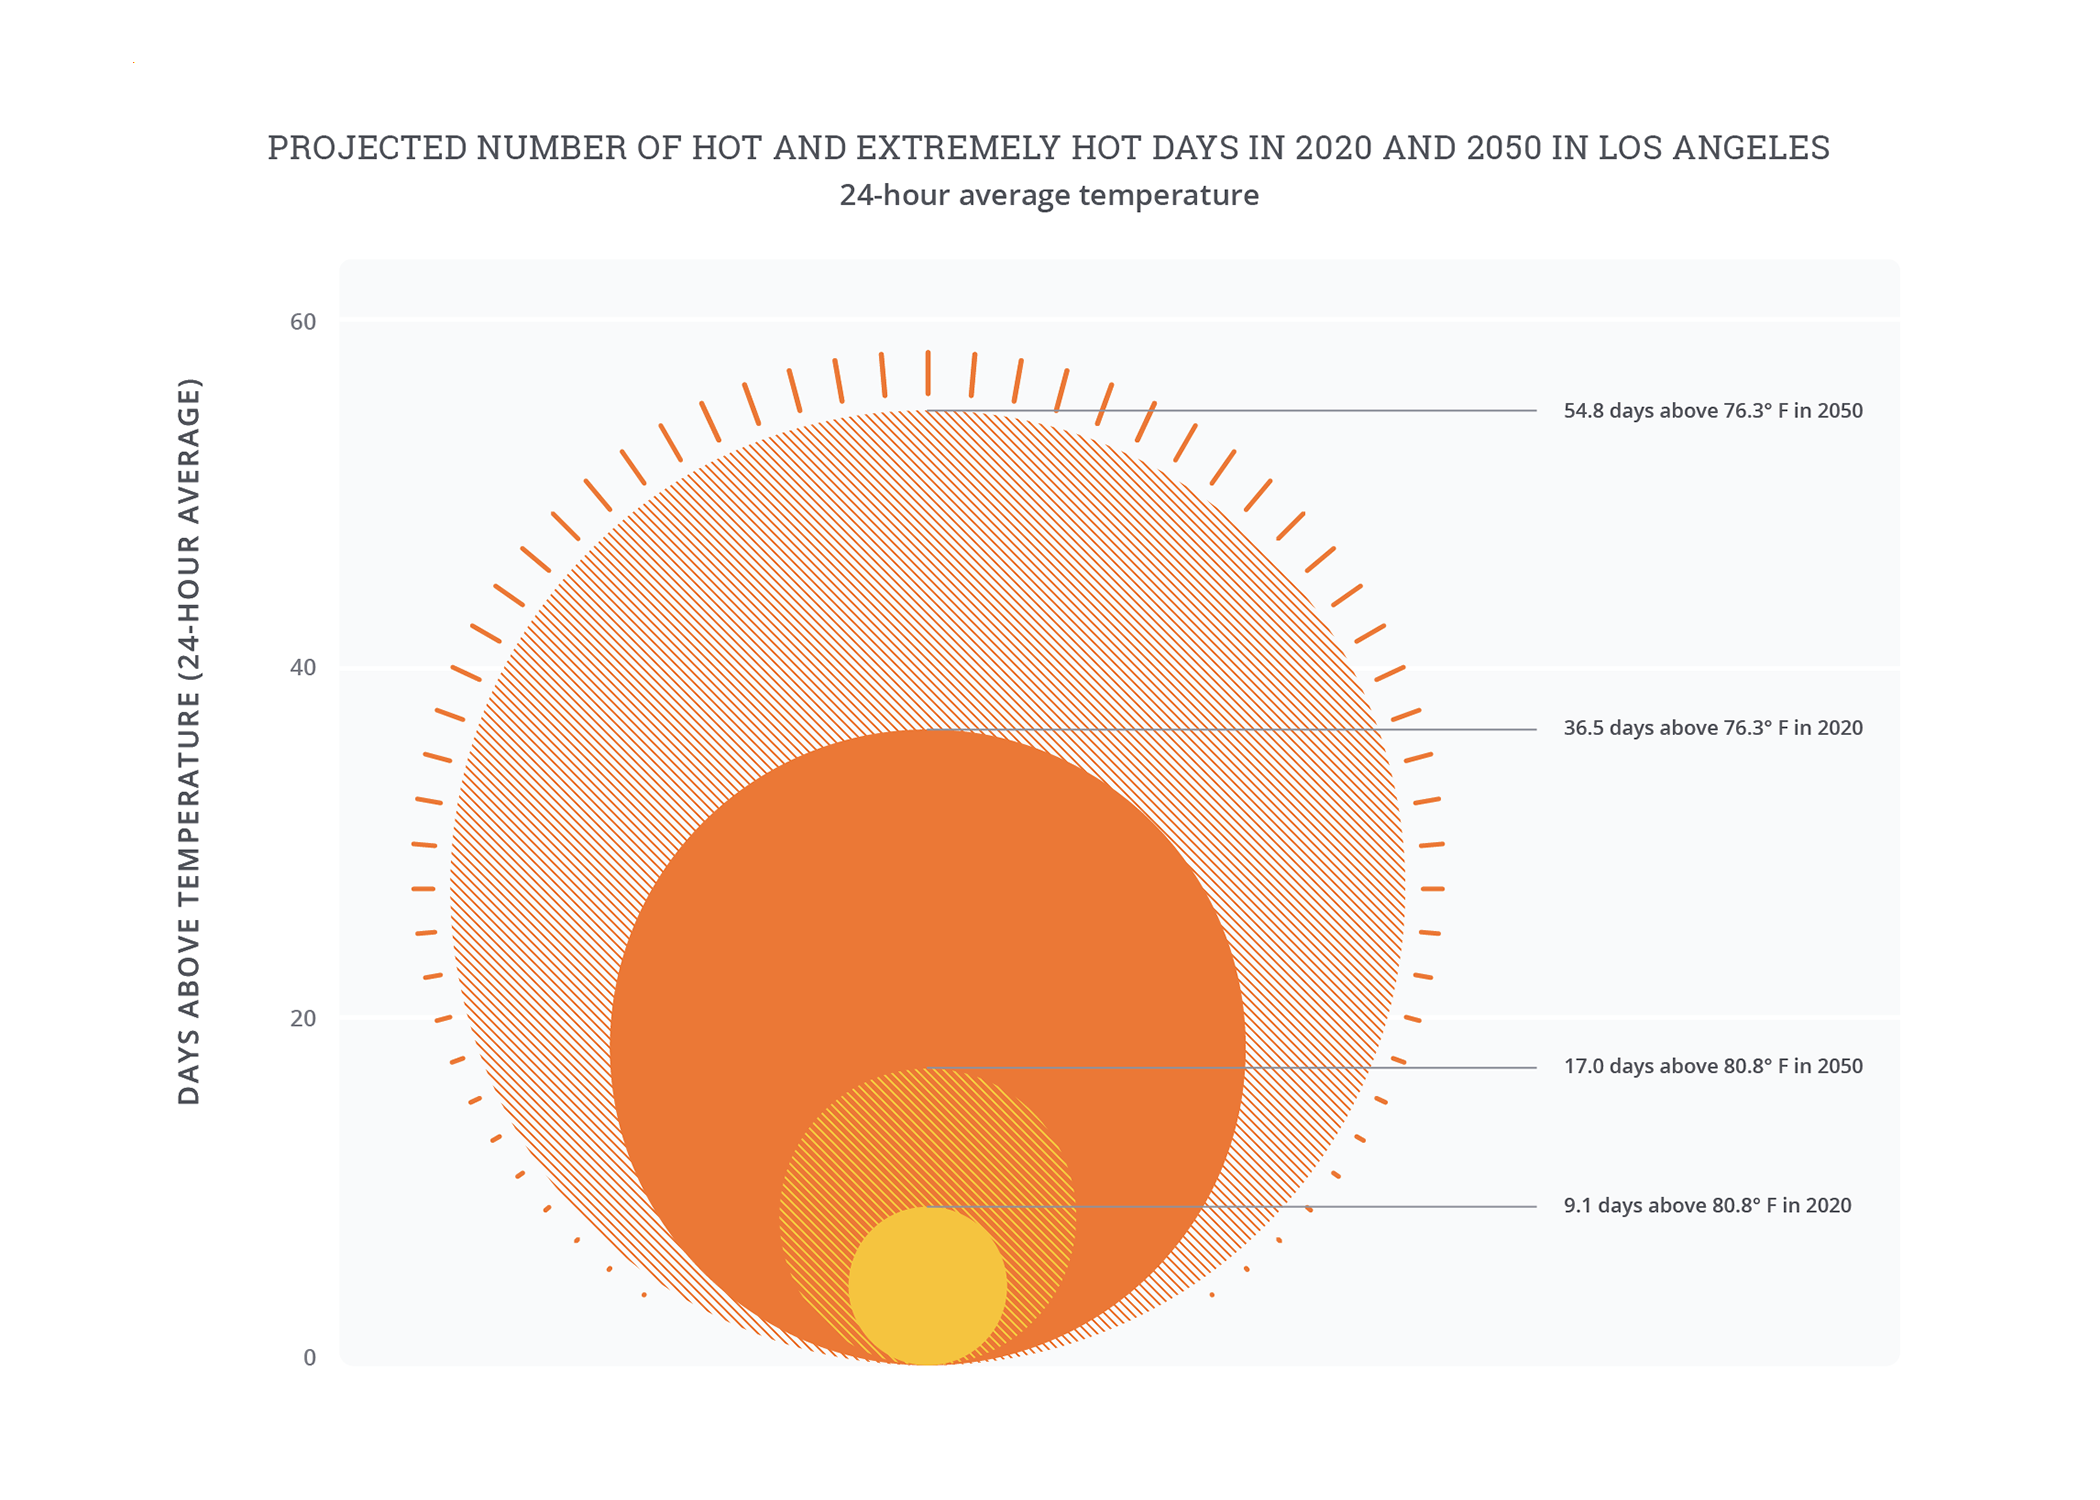
Los Angeles has almost 20 days a year with an average heat index of 90°F or higher, with peaks of up 45°C (113°F) in recent years.2 Los Angeles enjoys warm days with cooler nights, allowing people to recover and bringing down the average temperature. However, this is changing with warming nights. Furthermore, the more moderate average temperatures disguise sharp peaks of over 37°C (100°F) in the summer months, exceeding human body temperature. These heatwaves are increasing in frequency and severity, a trend which is set to continue to 2050. Without global action to reduce emissions, the number of ‘hot’ days is set to increase from between 9 and 10 to 17 days in a normal year by 2050.
The exposed surfaces of major, multilane highways capture heat and intensify its impact on residents. These paved areas contribute to Urban Heat Island (UHI) hotspots that can be as much as 12°C (22°F) hotter than rural surroundings, with hotspot areas set to expand by 2050.3 Built up areas downtown without significant tree cover likewise suffer from their exposure to the city’s frequently baking sun.4 According to the Los Angeles County Climate Vulnerability Assessment, outdoor workers in metro LA neighborhoods are particularly exposed due to lower-than-average tree canopy cover and permeable surfaces.5 Tree canopy cover in Santa Fe Springs ranges from 3 percent to 8 percent,6 compared to a 15 percent urban tree cover average in California.7
Impacts of heat
Under current conditions, heat and humidity cost metro Los Angeles almost USD 5 billion of lost output due to reduced worker productivity in a typical year8—nearly half of the entirety of the city’s annual budget of USD 11.2 billion.9 This is expected to rise to USD 11 billion annually by 2050.10 Despite these large absolute losses, percentage output lost is relatively small (0.5 percent in current conditions) due to the scale of the metro Los Angeles economy. Growing output losses reflect both increased heat resulting from climate change, and projected growth of the metro’s economy and labor force (37 percent increase in output expected over 2020-2050). However, output losses reported here capture only the direct effect of reduced worker productivity, and not any other impacts of heat or the indirect economic losses caused as lower output reduces overall spending and demand across all sectors.
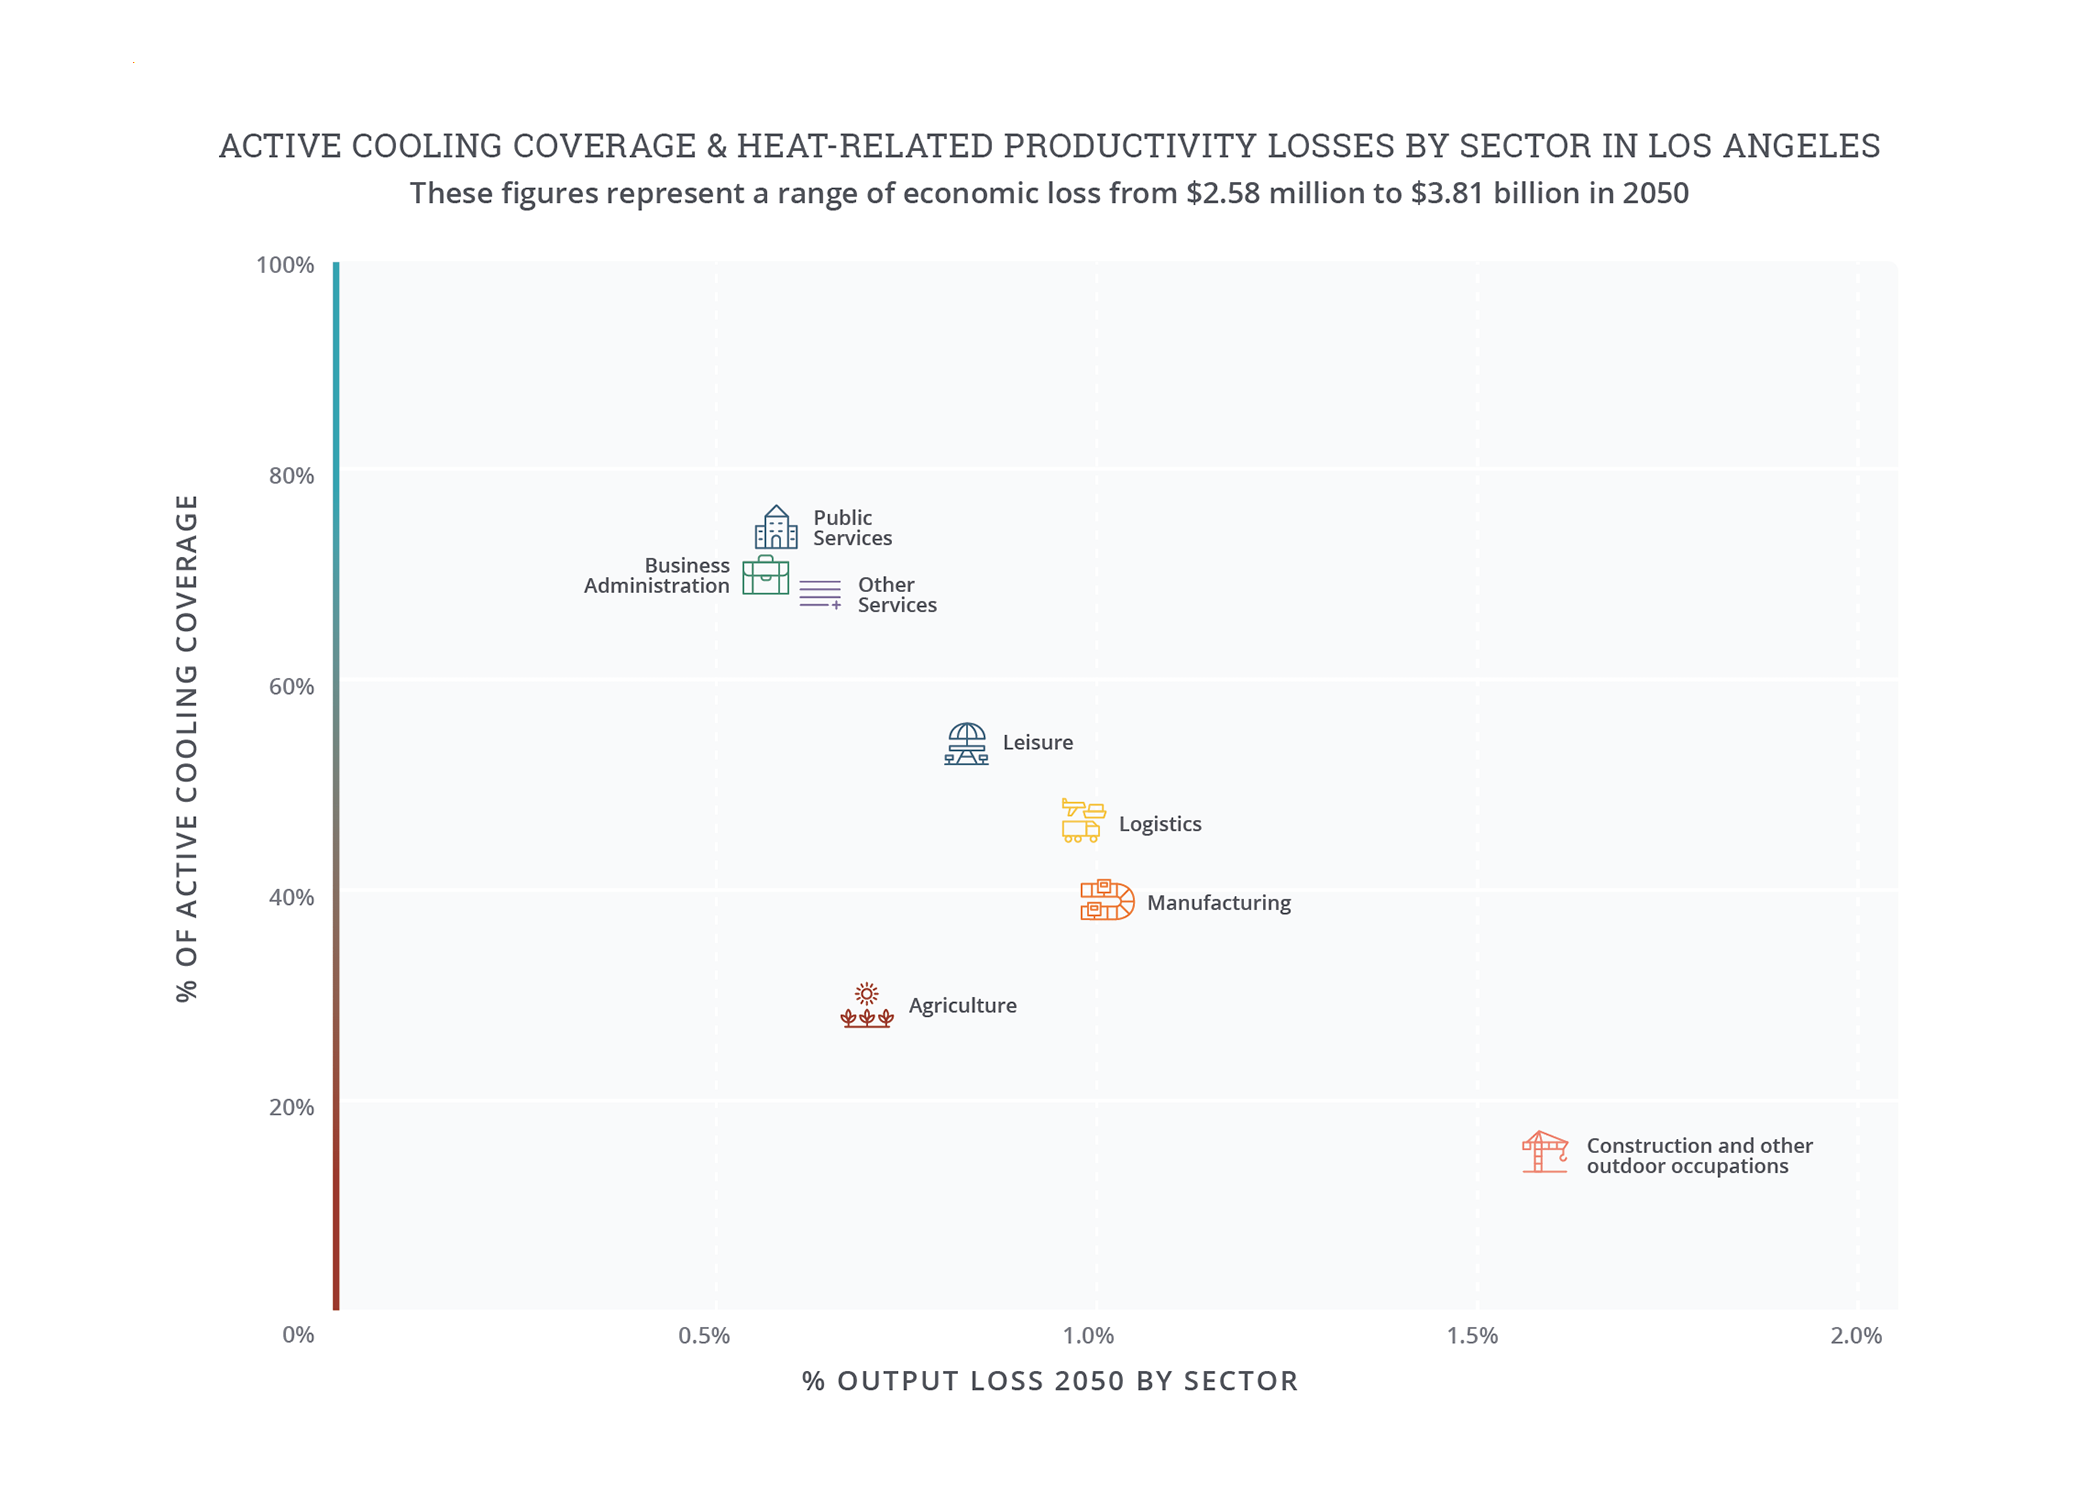
Every sector of the city’s economy is affected, with absolute losses concentrated in finance, insurance, and real estate, but with disproportionate impacts on construction workers. Losses are first a function of a sector’s overall economic importance—Los Angeles’s finance and real estate sectors account for 20 percent of output and 16 percent of total losses (valued at USD 880 million per year)—and second of the sector’s vulnerability to heat. Proportional losses are greatest for sectors that rely on outdoor work or that lack air conditioning.
This means that productivity—and therefore wage—losses are likely to be concentrated where working conditions require more physical effort and more time exposed to heat. Construction and utility workers are particularly vulnerable, with losses 80 percent higher than their share of the city’s output due to an estimated two thirds of their working hours being spent outdoors. Informal workers, who are likely underrepresented in official data, also spend a significant amount of time outdoors and exposed to heat and are an important part of Los Angeles’s economy.11 Many exposed workers are not getting break time or support to which they are entitled: a survey by the USC Dornsife Center shows that of Los Angeles County workers who are highly exposed to heat, more than one in four reported getting neither paid sick leave nor extra break time during hot days.12
The health impacts of heat will likely be concentrated among the elderly, low-income, ethnic minority and homeless populations. Extreme heat leads to heightened mortality and morbidity risk, particularly among the elderly who will make up one in four residents of Los Angeles by 2030.13 Due to the effects of rising temperatures, Los Angeles can expect as many as 3.3 times more heat-related deaths per year due to extreme heat by 2050, compared to 2020. For example, in 2006 a heatwave in California resulted in 16,000 emergency-room visits and 650 deaths, costing USD 5.3 billion. As well the direct impacts of heat on health, Los Angeles faces related hazards from wildfire and drought, which can both be triggered by and compound the physiological impacts of heat on LA’s population. Vulnerability to heat-related health conditions is concentrated in lower income, ethnic minority and homeless populations, and analysis of Urban Heat Islands at the census block level show that lower income communities have less access to cooling greenspace, such as parks, and lack the resources to install or operate air conditioning in their homes. Those experiencing homelessness are also 56 percent more likely to be hospitalized due to extreme heat.
The health impacts of heat in Los Angeles are expected to be concentrated among its elderly, low-income, ethnic minority, and homeless populations. Extreme heat leads to heightened mortality and morbidity risk, particularly among the elderly who will make up one in four residents of Los Angeles by 2030.13 For example, a 2006 heatwave in California resulted in 16,000 emergency-room visits and 650 deaths, costing USD 5.3 billion.14
Along with the direct impacts of heat on health, Los Angeles faces related hazards from wildfire and drought, which can both be triggered by and compound the physiological impacts of heat on Los Angeles’s population.15 Vulnerability to heat-related health conditions is concentrated in lower income, ethnic minority and homeless populations. Analysis of Urban Heat Islands at the census block level show that lower income communities have less access to cooling greenspace like parks and lack the resources to install or operate air conditioning in their homes.16 Those experiencing homelessness are also 56 percent more likely to be hospitalized due to extreme heat.17


Note on “Projected number of hot and extremely hot days”: Days where the twenty-four hour average (i.e., daily) temperature exceeds the local 90th percentile of the baseline average daily temperature are defined as “hot days,” while days where the daily temperature exceeds the local 97.5th percentile are defined as “extreme hot days.” Because hot days are relative to typical local temperatures, the same daily temperature may be considered “hot” in one city but not another. The baseline is based on historical climate data, 1985-2005, while 2050 is based on the 2040-2060 climate projection from an ensemble of CMIP6 models under RCP 7.0.
Note on “Productivity losses by sector”:9 The agricultural sector captures loss within the defined city limits and does not account for agricultural loss from the surrounding rural areas. Baseline losses are based on historical climate data from 1985-2005 and economic data from 2019. 2050 losses are based on the 2040-2060 climate projection from an ensemble of CMIP6 models under RCP 7.0 and economic models under SSP3. Losses assume no change in sectoral composition of economy. Source: Vivid Economics.
Note on “Active cooling coverage and heat related productivity losses by sector”: O*NET, 2021; and analysis by Vivid Economics.
Extreme heat interventions
Ongoing adaptation efforts can mitigate the impact of heat on Los Angeles’s economy and population, but the city will need to follow through on its ambitious strategies to achieve real impact for its most vulnerable populations. Current efforts include:
- Planning/policy: Existing adaptation plans will be strengthened by California’s Extreme Heat Action Plan (providing USD 300 million for adaptation measures) and Los Angeles’s Green New Deal.25 For example, the Green New Deal will create 250 miles of cool pavement, install shading at public transit stops, and develop “cool neighborhoods” with shading and water provisions targeting the elderly and people with disabilities.26 The plan also establishes ambitious targets, such as reducing the urban-rural temperature differential by at least 1.0°C (1.7°F) by 2025 and 1.7°C (3°F) by 2035.
- Communications/outreach: Los Angeles City Council voted to create the city’s first chief heat officer in November 2021, becoming the third city in the United States to do so. Los Angeles’s chief heat officer will raise public awareness on extreme heat and set targets towards adaptation, building on the results of the County Climate Vulnerability Assessment.27
- Investment in the built environment and nature-based solutions: Ongoing adaptation initiatives include Los Angeles’s Cool Roof ordinance, which was enacted in 2014 by the City of Los Angeles and in 2018 by Los Angeles County. It requires new roofs to reflect sunlight, absorb less heat, and increase energy efficiency, delivering up to 20 percent energy savings.28 Other planned activities include increasing Los Angeles’s tree canopy by 50 percent in the areas of greatest need by 2028.29
Explore more city chapters
Return to the global summary
Endnotes
1 To estimate economic losses, this study goes beyond political boundaries to give a sense of how extreme heat and humidity impact Los Angeles’ influence area. Core economic modeling considers the Combined Statistical Area of Los Angeles, Long Beach, and Santa Ana. The regional approach is to ensure that analysis covers populations that are central to Los Angeles’ growth and urban trajectory.
2 “Even higher temps expected on Labor Day as SoCal heat wave sets records,” Los Angeles Times, 2022, https://www.latimes.com/california/story/2022-09-04/searing-temperatures-continue-to-roast-southern-california-increasing-fire-risks; and NOAA NOAA Online Weather Data, 2022, https://www.weather.gov/wrh/climate?wfo=lox.
3 Analysis by Vivid Economics, based on summer average land surface temperature (LST), modeled climate data in 2050, and analysis of expected UHI and urban development from Huang et al. (2019). Projecting global urban land expansion and heat island intensification through 2050. Kangning Huang et al 2019 Environ. Res. Lett. 14 114037. Available at: https://iopscience.iop.org/article/10.1088/1748-9326/ab4b71
4 NOAA (2021). Comparative Climatic Data (CCD), data through 2004 available at: https://www.ncei.noaa.gov/pub/data/ccd-data/pctposrank.txt.
5 Los Angeles County (2021). Climate Vulnerability Assessment. Available at: https://ceo.lacounty.gov/wp-content/uploads/2021/10/LA-County-Climate-Vulnerability-Assessment-1.pdf.
6 Tree Equity Score. Available at: https://www.treeequityscore.org/map/#11.78/33.93065/-118.06368
7 ArcGIS Hub, US Forest Service. Urban tree canopy in California. https://hub.arcgis.com/maps/usfs::urban-tree-canopy-in-california/about.
8 Economic data in this report are from 2019 to avoid capturing the effect of Covid-19 on the economies of the cities analyzed. See methodology for further details
9 Los Angeles City 2021-2022 proposed budget. Available at: https://cao.lacity.org/budget/index.htm.
10 Workability analysis is based on climate factors and not indoor working conditions determined by the built environment characteristics or workplace layout (e.g. equipment that generates heat, body heat in close spaces, ventilation or greenhouse effects from windows, external shading). In practice, some of these factors can make indoor environments hotter than the modeled climate conditions suggest. Further, all output is measured based on gross value added (GVA), or the value of goods and services produced in an area. All analysis is based on RCP 7.0 and SSP3 using an ensemble mean of CMIP6 models. See accompanying methodology document for details.
11 KCET. “The Informal Economy: De-Criminalizing Street Vending in Los Angeles.” Available at: https://www.kcet.org/shows/city-rising/clip/the-informal-economy-de-criminalizing-street-vending-in-los-angeles.
12 Los Angeles County (2021). Climate Vulnerability Assessment. Available at: https://ceo.lacounty.gov/wp-content/uploads/2021/10/LA-County-Climate-Vulnerability-Assessment-1.pdf.
13 Los Angeles Controller (2020). Engaging Older Angelenos. Available at: https://lacontroller.org/audits-and-reports/engaging-older-angelenos/#:~:text=Approximately%20764%2C000%20residents%20of%20the,in%20four%20Angelenos)%20by%202030.
14 Patrick Sisson, “Los Angeles Is in a Race against Heat, and Low-income Workers Are Losing,” City Monitor, updated August 2, 2021, https://citymonitor.ai/community/public-health/los-angeles-is-in-a-race-against-rising-temperatures-and-low-income-workers-are-losing; “The L.A. Times investigation into Extreme Heat’s Deadly Toll,” Los Angeles Times, October 7, 2021, https://www.latimes.com/environment/story/2021-10-07/la-times-investigation-extreme-heat; and Evan Bush and Alicia Victoria Lozano, “‘An Invisible Hazard’: Warming Cities Hire Chief Heat Officers to Tackle Growing Threat,” NBC, updated June 17, 2022, https://www.nbcnews.com/science/science-news/-invisible-hazard-warming-cities-hire-chief-heat-officers-tackle-growi-rcna5926.
15 For example, by 2050 a forty-fold increase of wildfire burn areas is expected, compared to current levels; see “Los Angeles,” Encyclopaedia Britannica, 2022, https://www.britannica.com/place/Los-Angeles-California#ref260694.
16 Tony Barboza and Ruben Vives, “Poor neighborhoods bear the brunt of extreme heat, ‘legacies of racist decision-making,’” Los Angeles Times, October 28, 2021, https://www.latimes.com/california/story/2021-10-28/extreme-heat-built-environment-equity.
17 Lara Schwarz et al., “Heat Waves and Emergency Department Visits among the Homeless, San Diego, 2012–2019,” American Journal of Public Health 112, no. 1 (2022): 98-106, https://doi.org/10.2105/AJPH.2021.306557.
18 California Workforce Development Board (2019). The High Road to the Port of LA. Available at: https://cwdb.ca.gov/wp-content/uploads/sites/43/2019/11/High-Road-to-the-Port-11-25-2019_ACCESSIBLE.pdf
19 Annual Financial Report, Port of Los Angeles, 2021, https://www.portoflosangeles.org/business/finance/financial-statements and https://polb.com/business/finance/#annual-reports-acfr.
20 Port of Los Angeles (2022). Facts and Figures. Available at: https://www.portoflosangeles.org/business/statistics/facts-and-figures; and Port of Long Beach (2022). Port Facts and FAQs. Available at: https://polb.com/port-info/port-facts-faqs/#facts-at-a-glance.
21 Los Angeles County Climate Vulnerability Assessment, Los Angeles County, 2021, https://ceo.lacounty.gov/wp-content/uploads/2021/10/LA-County-Climate-Vulnerability-Assessment-1.pdf.
22 Natalie Kitroeff, “Immigrants flooded California construction. Worker pay sank. Here’s why,” LA Times, April 22, 2017, https://www.latimes.com/projects/la-fi-construction-trump/
23 Riley K, Wilhalme H, Delp L, Eisenman DP. “Mortality and Morbidity during Extreme Heat Events and Prevalence of Outdoor Work: An Analysis of Community-Level Data from Los Angeles County, California.” Int J Environ Res Public Health. March 23, 2018 15(4):580. doi: 10.3390/ijerph15040580. PMID: 29570664; PMCID: PMC5923622. https://www.ncbi.nlm.nih.gov/pmc/articles/PMC5923622/
24 Los Angeles County (2021). LA County Climate Vulnerability Assessment. Available at: https://ceo.lacounty.gov/wp-content/uploads/2021/10/LA-County-Climate-Vulnerability-Assessment-1.pdf
25 “California Releases Extreme Heat Action Plan to Protect Communities from Rising Temperatures,” Office of Governor Gavin Newsom, September 2022, https://www.gov.ca.gov/2022/04/28/california-releases-extreme-heat-action-plan-to-protect-communities-from-rising-temperatures/; and L.A.’s Green New Deal (2019) https://plan.lamayor.org/sites/default/files/pLAn_2019_final.pdf.
26 “Heat Vulnerability in Los Angeles County,” Center for Resilient Cities and Landscapes, 2020, https://static1.squarespace.com/static/5dba154a6b94a433b56a2b1d/t/6026bad8d2340a771606e2bc/1613150954188/LA+County_Heat_report.pdf
27 Eva Bush and Alicia Victoria Lozano, “An invisible hazard: Warming cities hire chief heat officers to tackle growing threat,” NBC, November 21, 2021, https://www.nbcnews.com/science/science-news/-invisible-hazard-warming-cities-hire-chief-heat-officers-tackle-growi-rcna5926.
28 “2019 Local Building Standards Ordinance,” County of Los Angeles, 2019, https://ceo.lacounty.gov/wpcontent/uploads/2021/09/County-of-Los-Angeles-Cool-Roof-2019-Ordinance-0061.pdf.
29 Los Angeles Green New Deal Plan, County of Los Angeles, 2019, https://plan.lamayor.org/sites/default/files/pLAn_2019_final.pdf.
