Overview
Monterrey’s hot, semiarid climate makes it one of the hottest cities in Mexico. Temperatures are particularly high in its built-up urban core where green space is scarce: they are 5°C warmer than nearby rural areas and are projected to become 10°C warmer by 2050.
Heat- and humidity-related labor productivity losses in Monterrey are already causing economic damages in a typical year valued at over USD 1.8 billion (USD 1.81 billion/MXN 35.1 billion), on a par with losses from the worst natural disasters in the region, such as 2010’s Hurricane Alex. Without adaptation or global action to reduce emissions, this impact could double as a share of output by 2050, reaching USD 4 billion (USD 4.05 billion/MXN 78.6 billion).
Compared to other cities in this study, labor productivity impacts are concentrated in manufacturing, with two-thirds of the city’s overall losses falling in the sector. Controlling these losses, which are otherwise projected to grow from 0.9 percent to 1.5 percent of output by 2050, could involve moderating indoor temperatures through active and passive cooling as well as the uptake of technologies to reduce heat from machinery.
Adaptation in Monterrey has been driven largely by the private sector and nonprofit organizations investing in new designs for passive cooling; insights from these pilots can inform essential future heat-proofing investments under the direction of its newly appointed Chief Heat Officer.
Extreme heat conditions
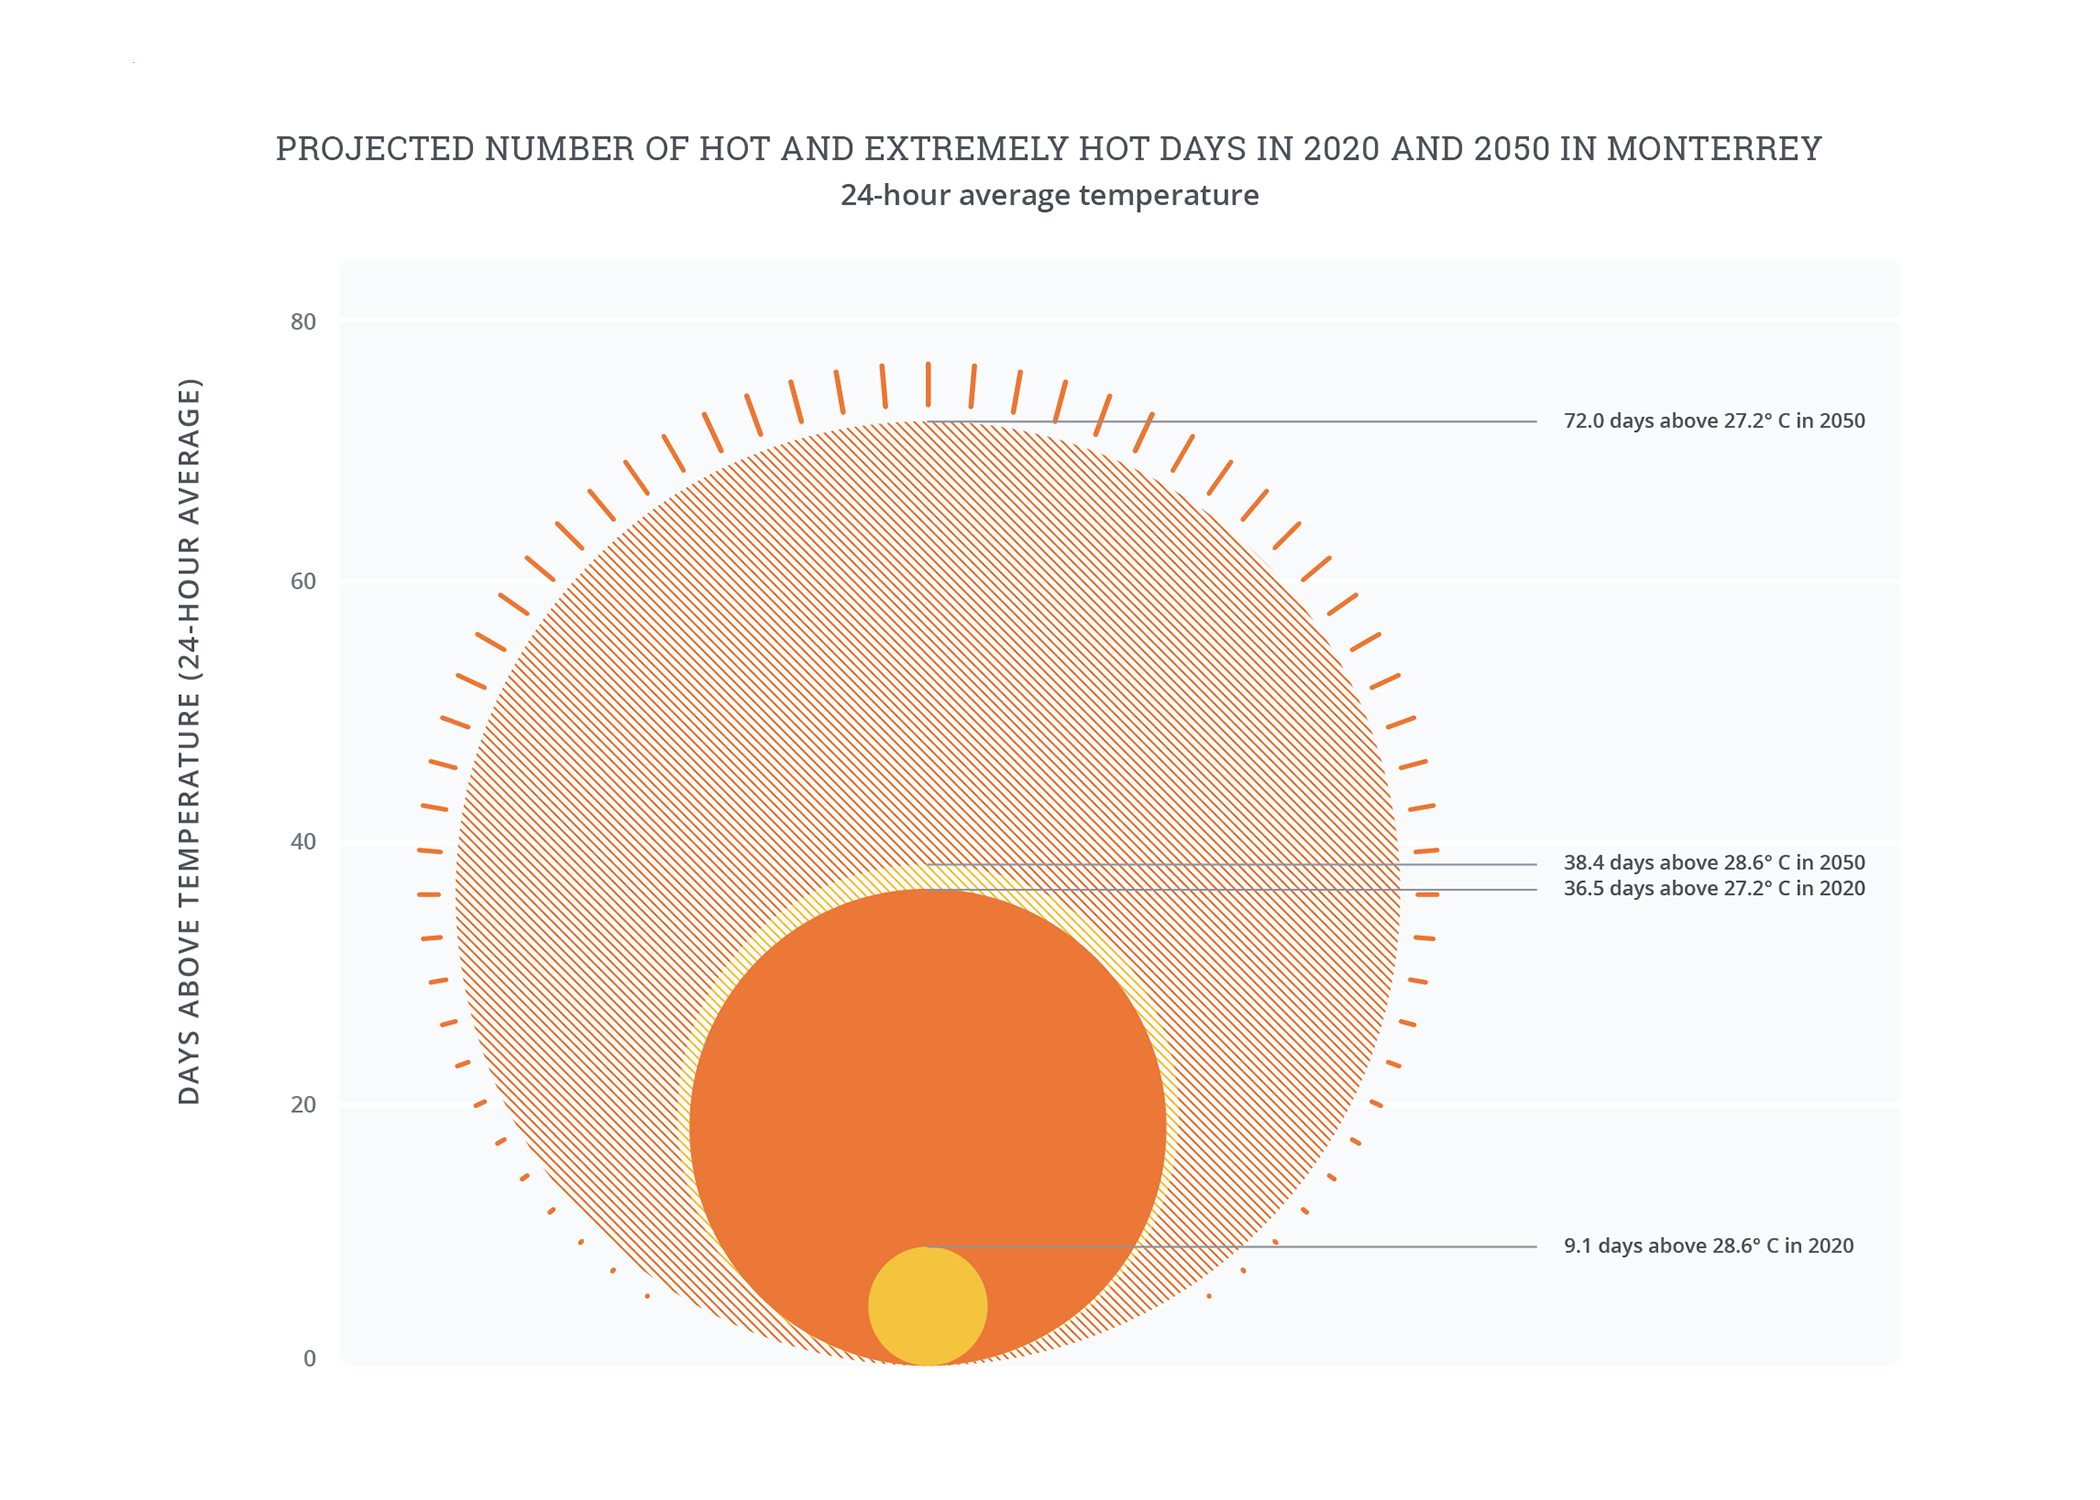
Monterrey’s1 hot, semiarid climate makes it one of the hottest cities in Mexico, and temperatures are particularly high in its built-up urban core. The city has a record high of 48°C,2 and in recent decades daily average temperatures have exceeded 28.6°C for around ten days a year.3 By 2050, nearly forty days—over one month every year—are predicted to exceed this threshold, and the ten hottest days will have an average temperature of 30.1°C or hotter. Monterrey’s urban core is currently around 5°C warmer than surrounding rural areas, but further urbanization combined with climate-driven temperature increases are set to drive this figure to around 10°C by 2050.4 This is partially due to a low level of cooling green space for urban residents. There is just 3.9 square meters of urban green space per inhabitant in Monterrey municipality,5 compared to a commonly referenced target of 9 square meters of urban green space per inhabitant.6
Impact of extreme heat
Monterrey’s heat- and humidity-related labor productivity losses are already causing economic damages at a similar level to natural disasters in the region: without adaptation, this impact could double as a share of output by 2050. Monterrey has a higher share of active work, such as in manufacturing, than many other global cities, but has relatively low shares of outdoor work,7 particularly in its higher value sectors such as manufacturing, logistics, and business administration.
Combined with its warm climate, this leads to losses of 0.9 percent of current output—approximately USD 1.8 billion (USD 1.81 billion / MXN 35.1 billion8) in a typical year around 2020.9
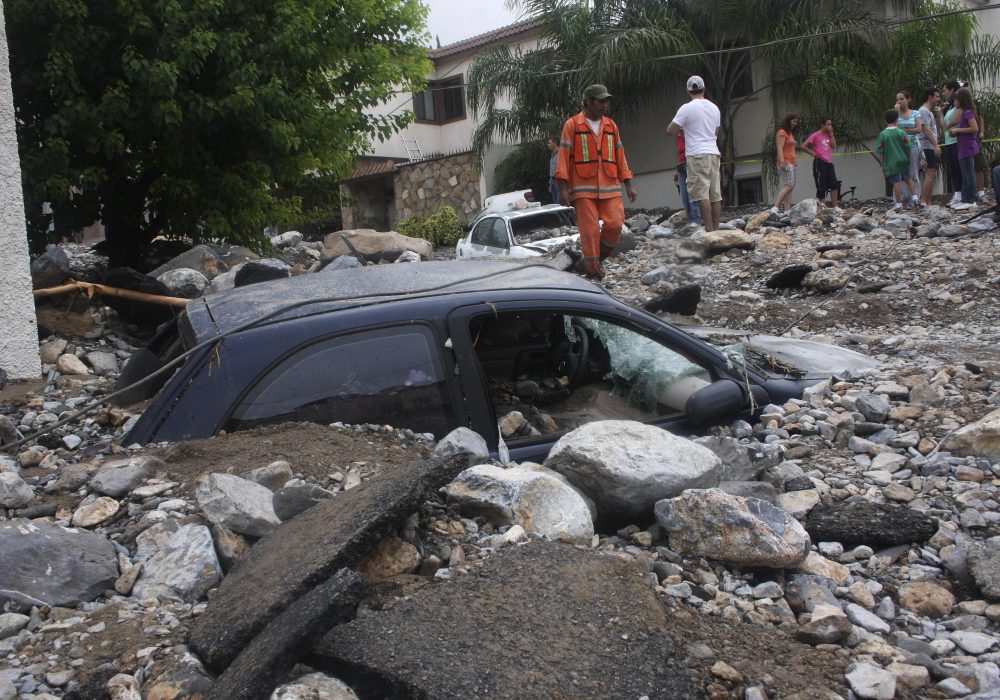
By comparison, Hurricane Alex, which has been called “the worst weather phenomenon” in Monterrey’s history,10 destroyed significant housing and transport, power, and water infrastructure in 2010, with damage repairs costing an estimated USD 1.3 billion to 2.1 billion (MXN 25.2 to 40.1 billion).11
Without enhanced adaptation, heat-related productivity losses are projected to increase to 1.5 percent of output by 2050. Even with conservative estimates of gross domestic product (GDP) growth, the absolute value of these losses could exceed USD 4 billion (USD 4.05 billion / MXN 78.6 billion).
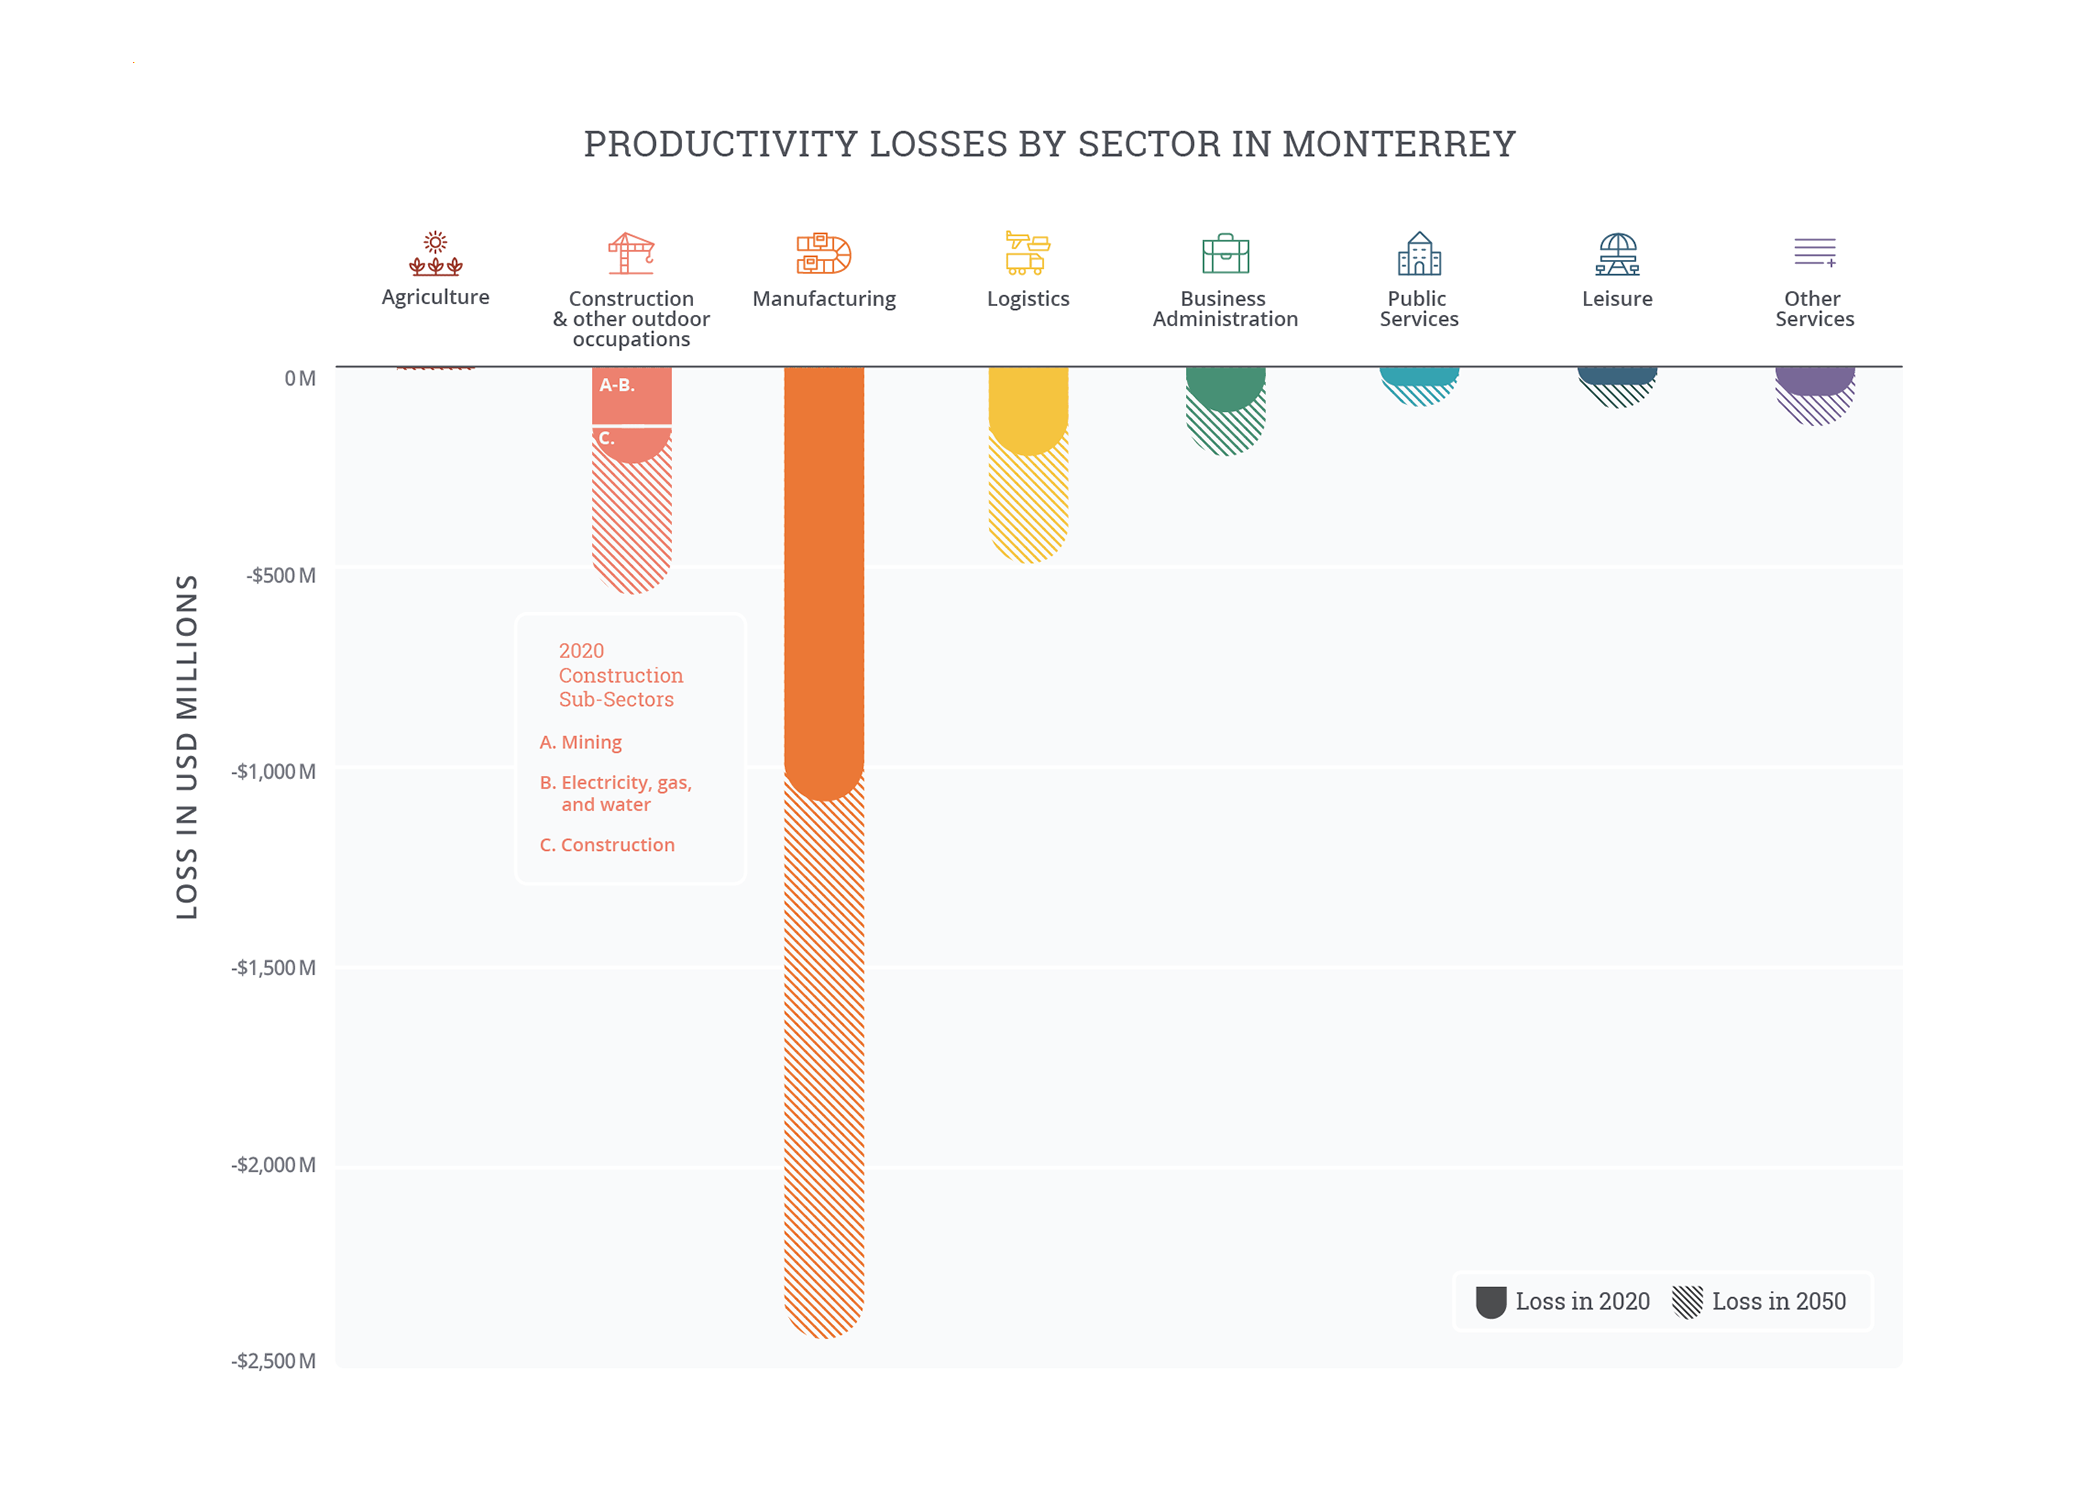
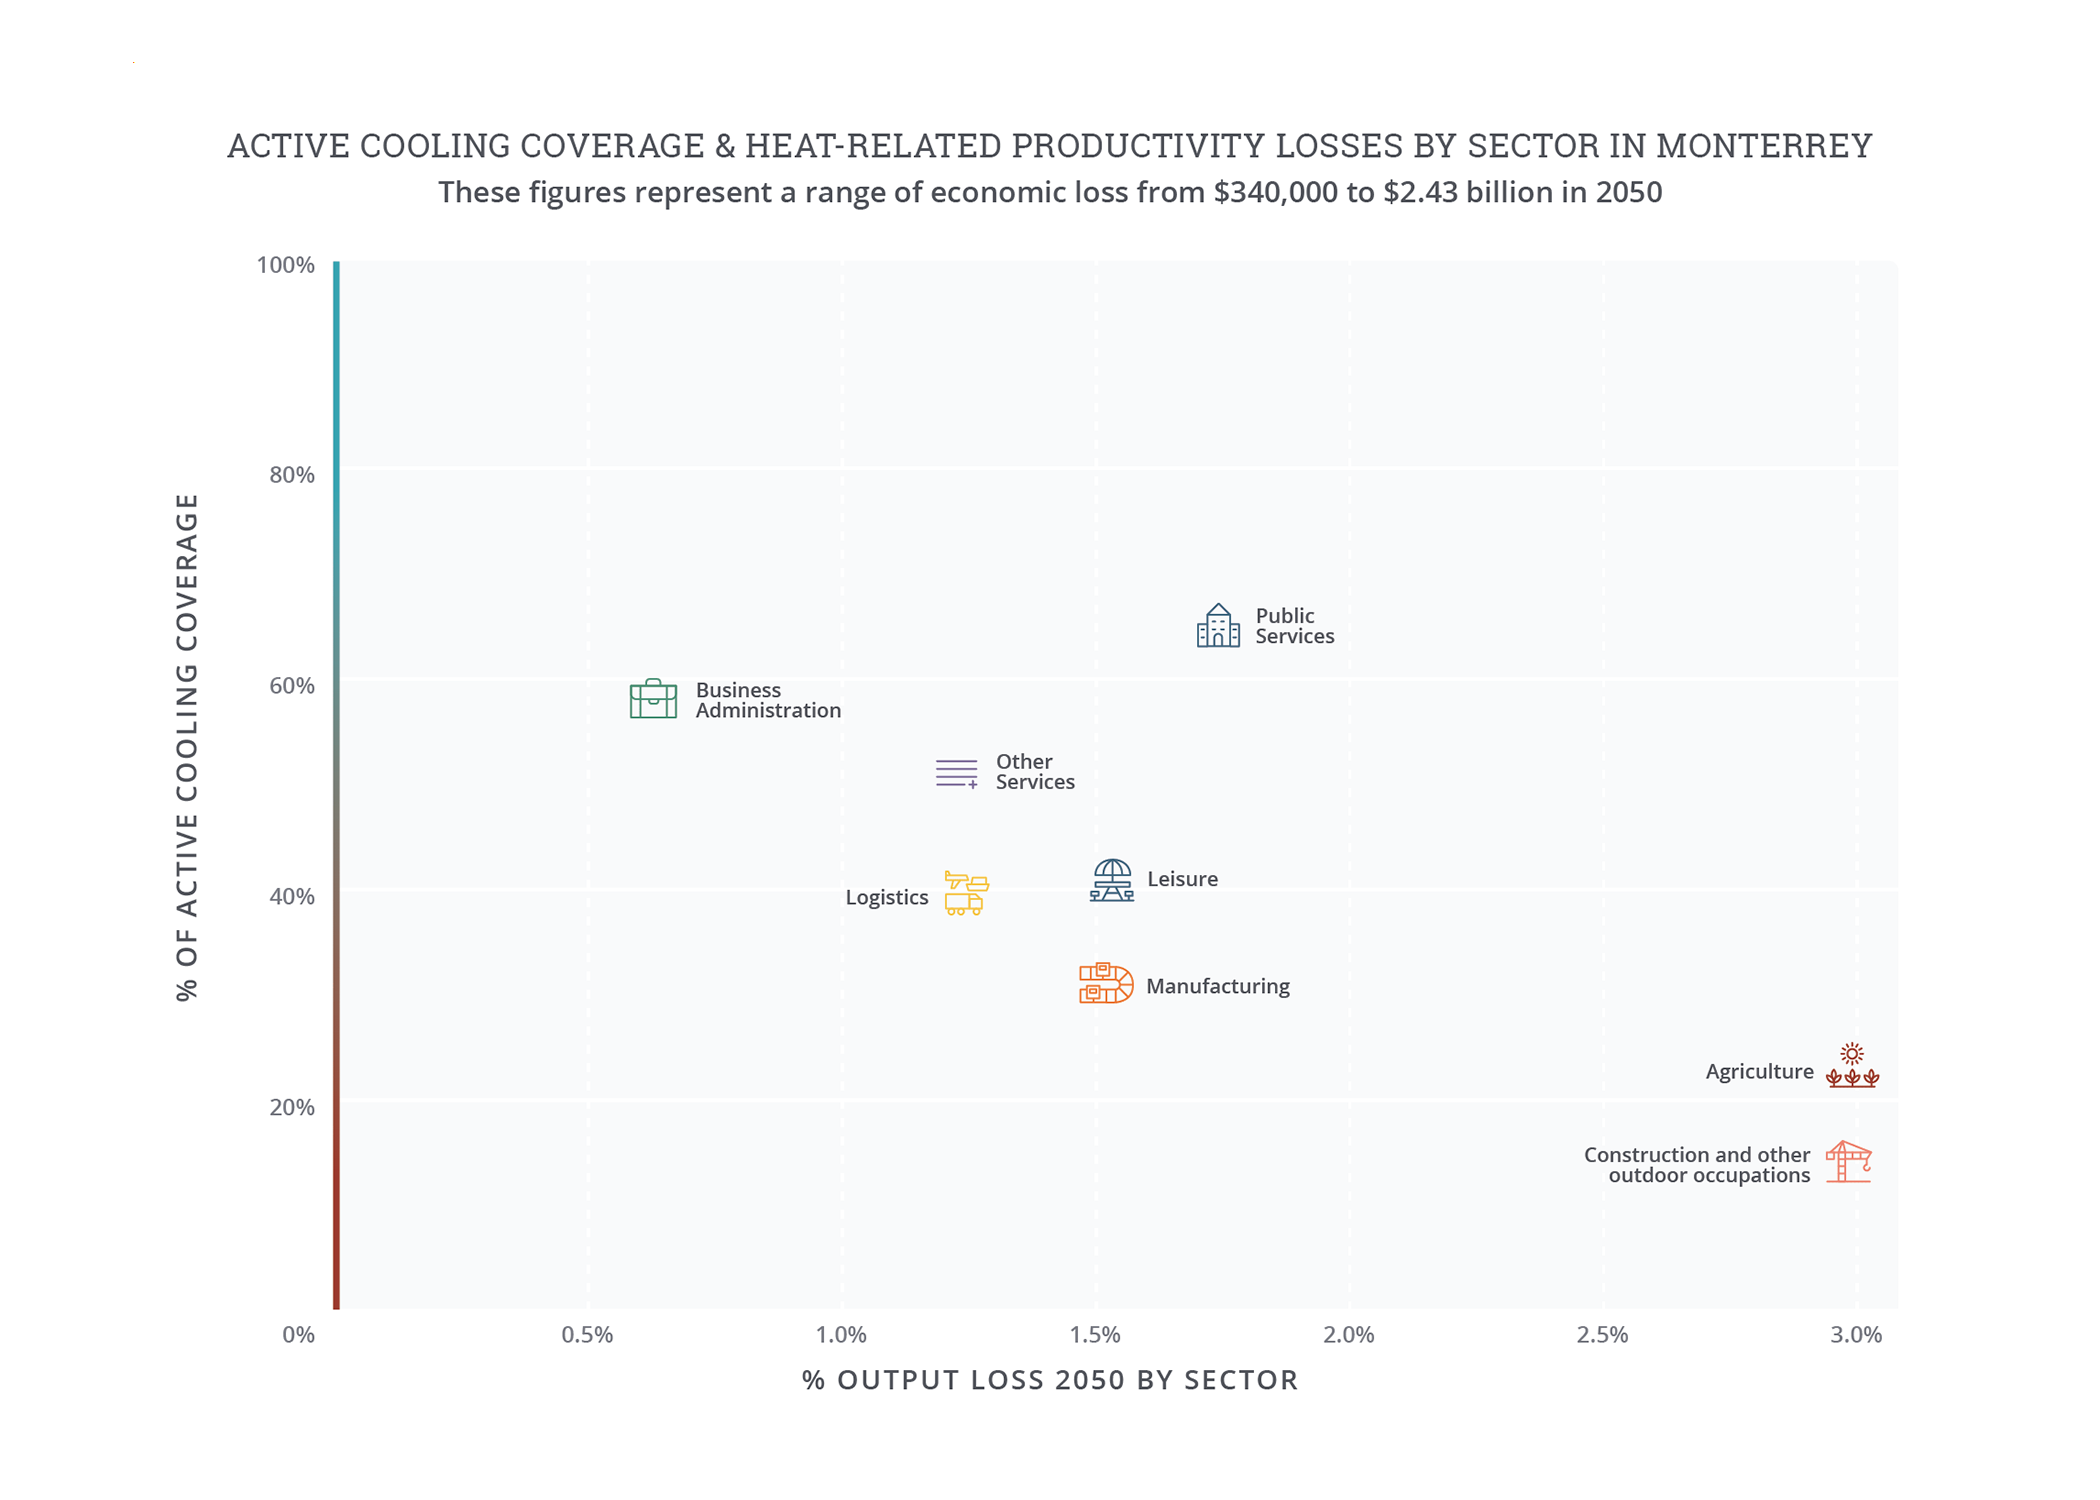
Monterrey’s manufacturing-focused economy faces higher heat exposure than many other global cities, driving almost two-thirds of the city’s overall losses. Over 55 percent of Monterrey’s economic activity and almost 30 percent of its employment is concentrated in manufacturing, a sector with relatively low levels of air-conditioning and high levels of active work (around 45 percent of manufacturing work takes place in active indoor roles, and 70 percent of working hours are spent in some degree of heat exposure).12

Labor-related productivity losses are consequently higher relative to cities with more service-centered economies in similar climates. Manufacturing is estimated to account for 60 percent of Monterrey’s total output losses, valued at over USD 1 billion (almost MXN 20 billion). These losses could be higher if heat’s effect on the operation of machinery is considered: the compounding effect of heavy machinery in raising temperatures in the workplace can be seen in the below section on manufacturing workers. By 2050, a combination of climate change and GDP growth are projected to drive losses up to USD 2.4 billion (MXN 46.6 billion).


Note on “Projected number of hot and extremely hot days”: Days where the twenty-four hour average (i.e., daily) temperature exceeds the local 90th percentile of the baseline average daily temperature are defined as “hot days,” while days where the daily temperature exceeds the local 97.5th percentile are defined as “extreme hot days.” Because hot days are relative to typical local temperatures, the same daily temperature may be considered “hot” in one city but not another. The baseline is based on historical climate data, 1985-2005, while 2050 is based on the 2040-2060 climate projection from an ensemble of CMIP6 models under RCP 7.0.
Note on “Productivity losses by sector”: The agricultural sector captures loss within the defined city limits and does not account for agricultural loss from the surrounding rural areas. Baseline losses are based on historical climate data from 1985-2005 and economic data from 2019. 2050 losses are based on the 2040-2060 climate projection from an ensemble of CMIP6 models under RCP 7.0 and economic models under SSP3. Losses assume no change in sectoral composition of economy. Source: Vivid Economics.
Note on “Active cooling coverage and heat related productivity losses by sector”: O*NET, 2021; and analysis by Vivid Economics.
Extreme heat interventions
Private-sector investment and pilot studies for heat resilience are already underway in Monterrey and across Mexico. To reduce economic losses and protect its population, Monterrey can expand upon and scale up existing adaptations focused on making heat more bearable in urban environments, under the direction of its newly appointed Chief Heat Officer. Actions include:
- Communications/outreach: The recent appointment of a Chief Heat Officer provides Monterrey with an opportunity to develop initiatives such as awareness campaigns and public capacity building for heat resilience.
- Investment in the built environment and nature-based solutions: Passive cooling building pilot studies, including in Monterrey, have shown promising results in using building design elements to reduce indoor temperature while limiting the need for active cooling.17 Heat-reducing urban design features are also employed in the Regeneración plan for the Monterrey Institute of Technology and Higher Education (Tecnológico de Monterrey), including features such as underground parking replacing heat-island above-ground lots, increased density to reduce overall demand for parking, use of canopies over exposed plazas, and maintaining features such as east-west orientation of roads that allow winds to cool the campus.18 Efforts from across Mexico can provide valuable lessons for how to expand heat resilience action in Monterrey. Mérida, in the state of Yucatán, has encouraged citizen participation in reforestation through creation of digital tools for urban tree management, while the German development agency known as GIZ has proposed large-scale green infrastructure projects across Mexico to address threats such as urban heat islands (UHI).19
Explore more city chapters
Return to the global summary
Endnotes
1 To estimate economic losses, this study goes beyond political boundaries to give a sense of how extreme heat and humidity impact Monterrey’s influence area. Core economic modeling considers the Metropolitan Area of Monterrey. The regional approach is to ensure that analysis covers populations that are central to Monterrey’s growth and urban trajectory.
2 Servicio Meteorologico Nacional.
3 All analysis is based on RCP 7.0 and SSP3 using an ensemble mean of CMIP6 models; see accompanying methodology document for details.
4 Analysis by Vivid Economics, based on summer average land surface temperature (LST), modeled climate data in 2050, and analysis of expected urban heat island (UHI) effect and urban development from Kangning Huang et al., “Projecting Global Urban Land Expansion and Heat Island Intensification through 2050,” Environmental Research Letters 14, no. 11, 2019.
5 Lina Ojeda-Revah et al., “Fragmented Urban Greenspace Planning in Major Mexican Municipalities,” Journal of Urban Planning and Development 146, no. 2 (2020), https://ascelibrary.org/doi/pdf/10.1061/%28ASCE%29UP.1943-5444.0000573.
6 See, for example, M. Wolff and D. Haase, “Mediating Sustainability and Liveability—Turning Points of Green Space Supply in European Cities,” Frontiers in Environmental Science 7, no. 61 (2019), doi: 10.3389/fenvs.2019.00061.
7 The workability analysis is based on climate factors and not indoor working conditions determined by built environment characteristics or workplace layout (e.g., equipment that generates heat, body heat in close spaces, ventilation or greenhouse effects from windows, external shading). In practice, some of these factors can make indoor environments hotter than the modeled climate conditions suggest.
8 Numbers are approximate and rounded to the nearest 10. Exchange rates from International Monetary Fund (2022). 2021 annual average exchange rate – 19.42 MXN/USD. Available at https://data.imf.org/regular.aspx?key=61545850.
9 Economic data in this report are from 2019 to avoid capturing the effect of COVID-19 on the economies of the cities analyzed; see methodology for further details. All output is measured based on gross value added (GVA), or the value of goods and services produced in an area.
10 Público, “Monterrey, la tercera mayor ciudad mexicana, colapsada por fuertes lluvias,” 2010, https://www.publico.es/actualidad/monterrey-tercera-mayor-ciudad-mexicana.html.
11 Ismael Aguilar-Barajas and Aldo I. Ramirez, “Recovering of the Monterrey Metropolitan Area, Mexico, After Hurricane Alex (2010): The Role of the Nuevo Leon State Reconstruction Council,” Frontiers in Environmental Science 7 (2019): 163, https://doi.org/10.3389/fenvs.2019.00163.
12 Based on data from O*NET, 2021; and analysis by Vivid Economics.
13 “Manufacturing in Monterrey Drives the Nuevo Leon Economy,” TECMA Group (website), accessed September 2022, https://www.tecma.com/manufacturing-in-monterrey/.
14 Employment data from National Institute of Statistics, Geography, and Informatics (INEG), https://www.inegi.org.mx/default.html, 2021.
15 Analysis by Vivid Economics.
16 Roland Jones, “Heat Stress Prevention: Safety in Manufacturing and Industrial Environments,” MSC Industrial Supply Co., Safety (webpage), April 1, 2021, accessed September 2022, https://www.mscdirect.com/betterMRO/safety/heat-stress-prevention-safety-manufacturing-and-industrial-environments.
17 Sydney Gladu, “Passive House Pilots Completed in Mexico,” Passive House Accelerator (website), December 22, 2020, https://passivehouseaccelerator.com/articles/passive-house-pilots-completed-in-mexico; and “This Market in Mexico Is a Solid Case Study for Passive Cooling and Post-occupancy,” Frame (platform), July 27, 2021, https://www.frameweb.com/article/this-market-in-mexico-is-a-solid-case-study-for-passive-cooling-and-post-occupancy.
18 Sasaki, “Regeneración: A Vision Plan for the Distrito Tec and the Monterrey Campus of the Instituto Tecnológico y de Estudios Superiores de Monterrey,” Issuu (platform), October 5, 2014, accessed September 2022, https://issuu.com/sasaki_associates/docs/mty_main_report_final_spreads.
19 Deutsche Gesellschaft für Internationale Zusammenarbeit (GIZ), CiClim 2017-2020: Lecciones aprendidas del Proyecto Protección del Clima en la Política Urbana de México, 2020, https://ciudadesytransporte.mx/wp-content/uploads/2021/08/lecciones_aprendidas_del_proyecto_proteccion_del_clima_en_la_politica_urbana_de_mexico_ciclim_2017-2020.pdf; and GIZ, El papel de ls ciudades en la recuperacion verde en Mexico, 2020, https://www.giz.de/en/downloads/Documento-recuperacioon-verde_versionGIZ_final.pdf.
