Overview
Extreme heat is already a severe hazard in New Delhi, and it is set to become more intense and more frequent as climate change progresses.
Average labor productivity losses are 20 percent for indoor or shaded workers, and 25 percent for those working under the heat of the sun: by 2050, it could be losses of 24 percent and 30 percent, respectively.
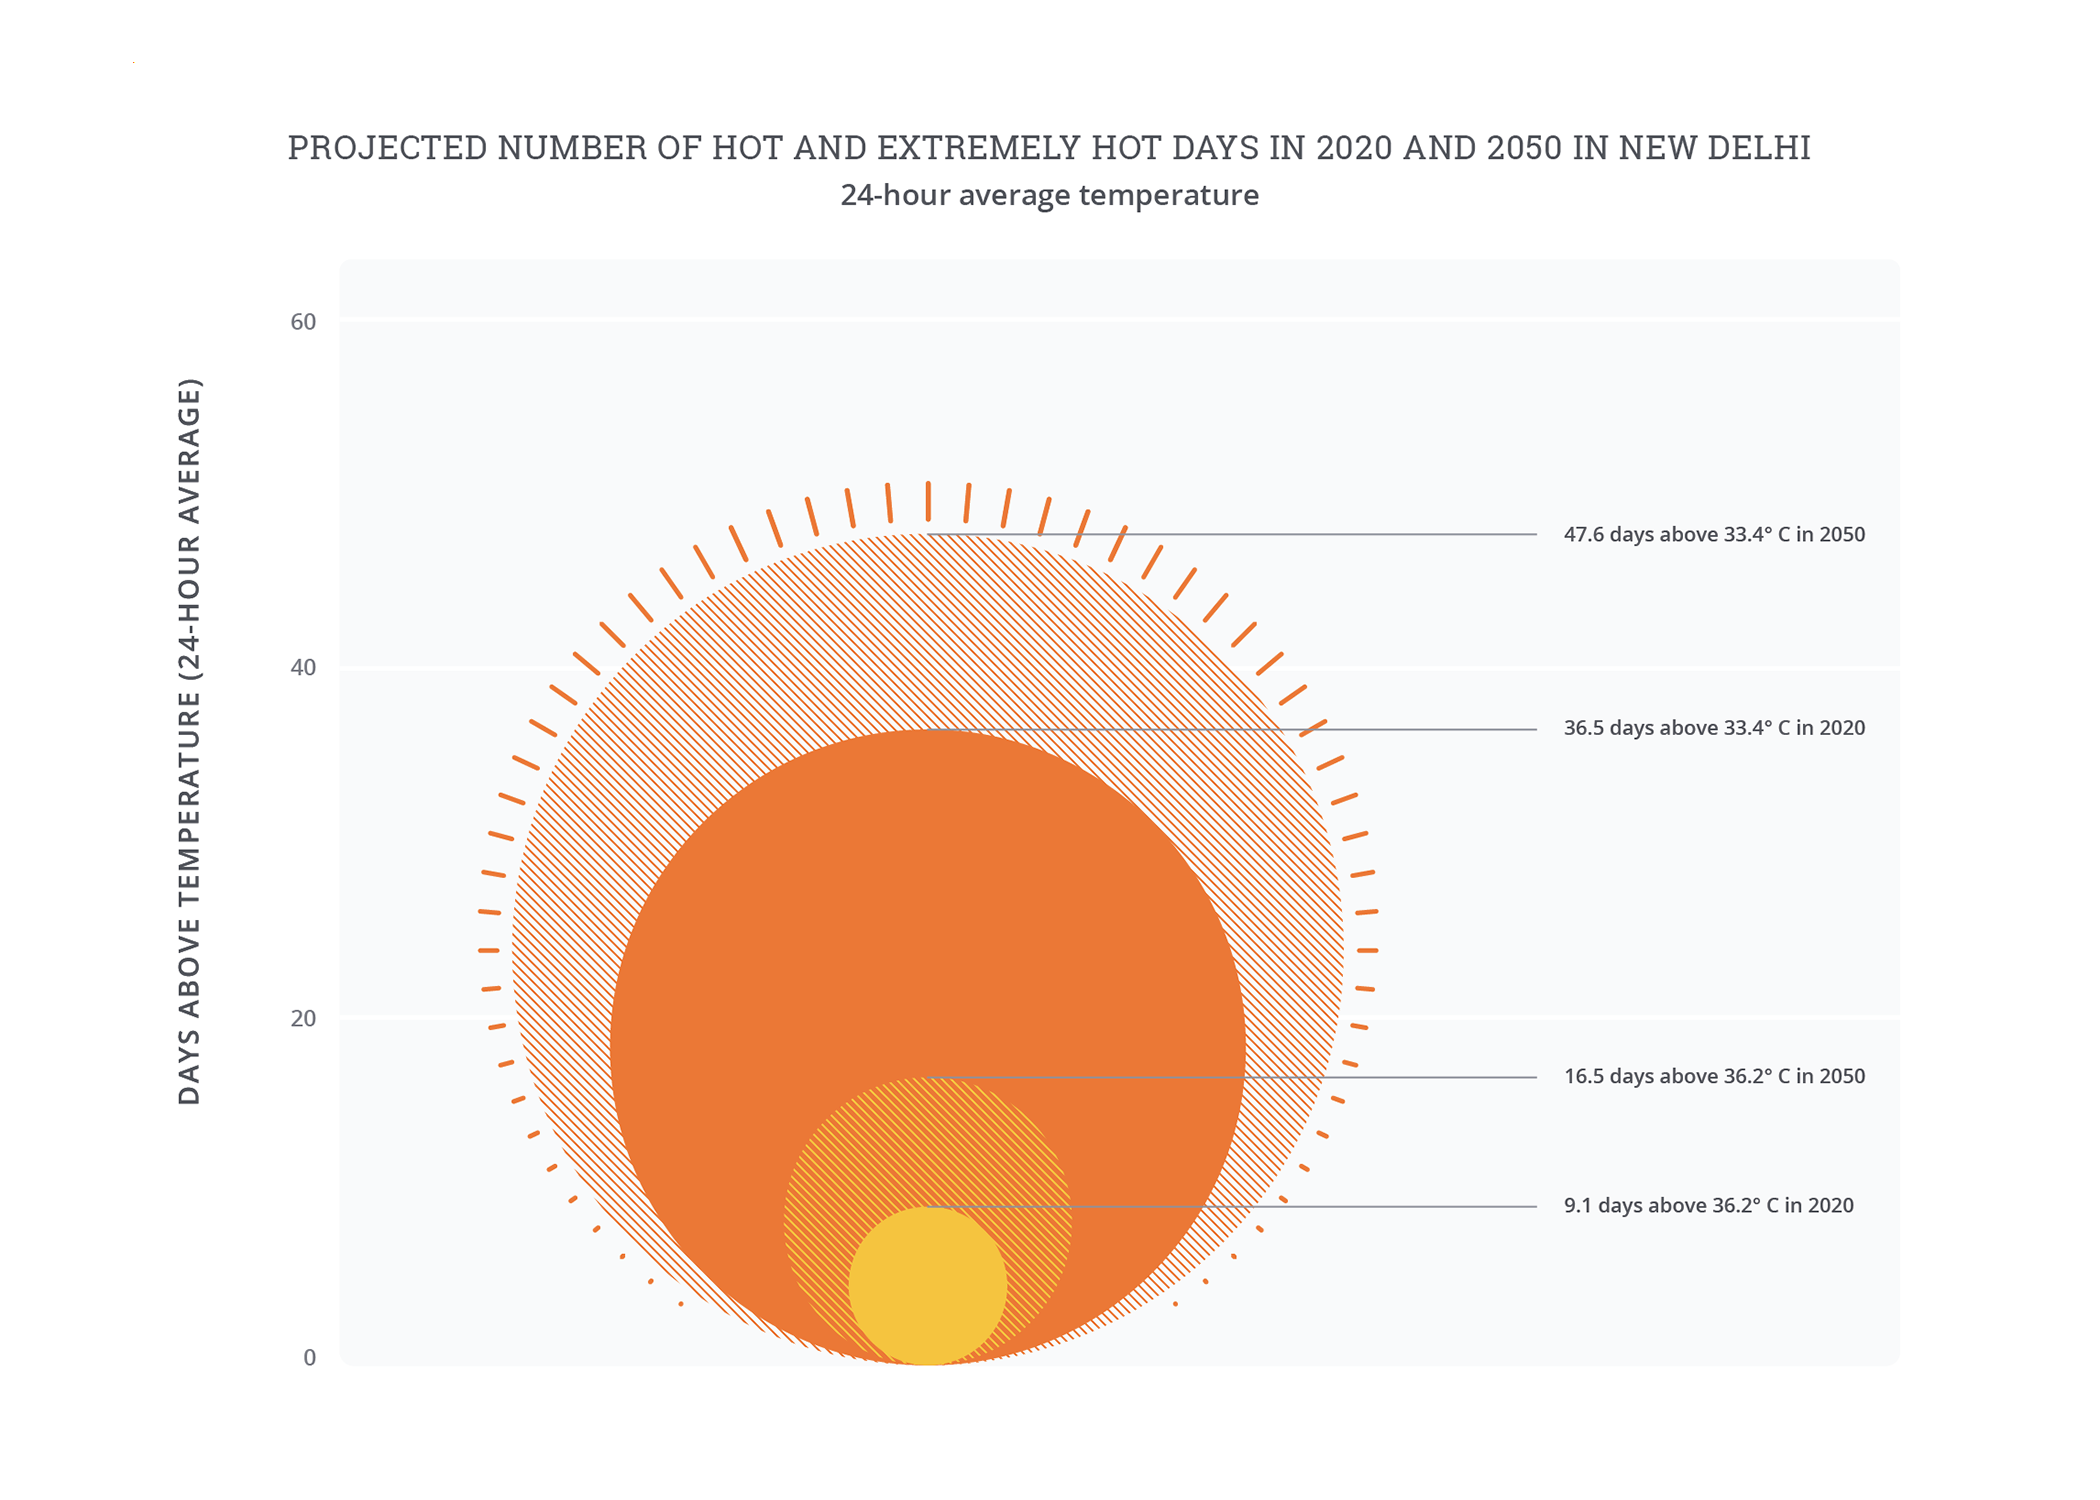
In a typical year, mean temperatures (including overnight lows) exceed 33.4°C for thirty-six days, and the hottest ten days average over 36.2°C. The impact of extreme heat on labor productivity alone already amounts to 4 percent of New Delhi’s output, rising to 5 percent by 2050.
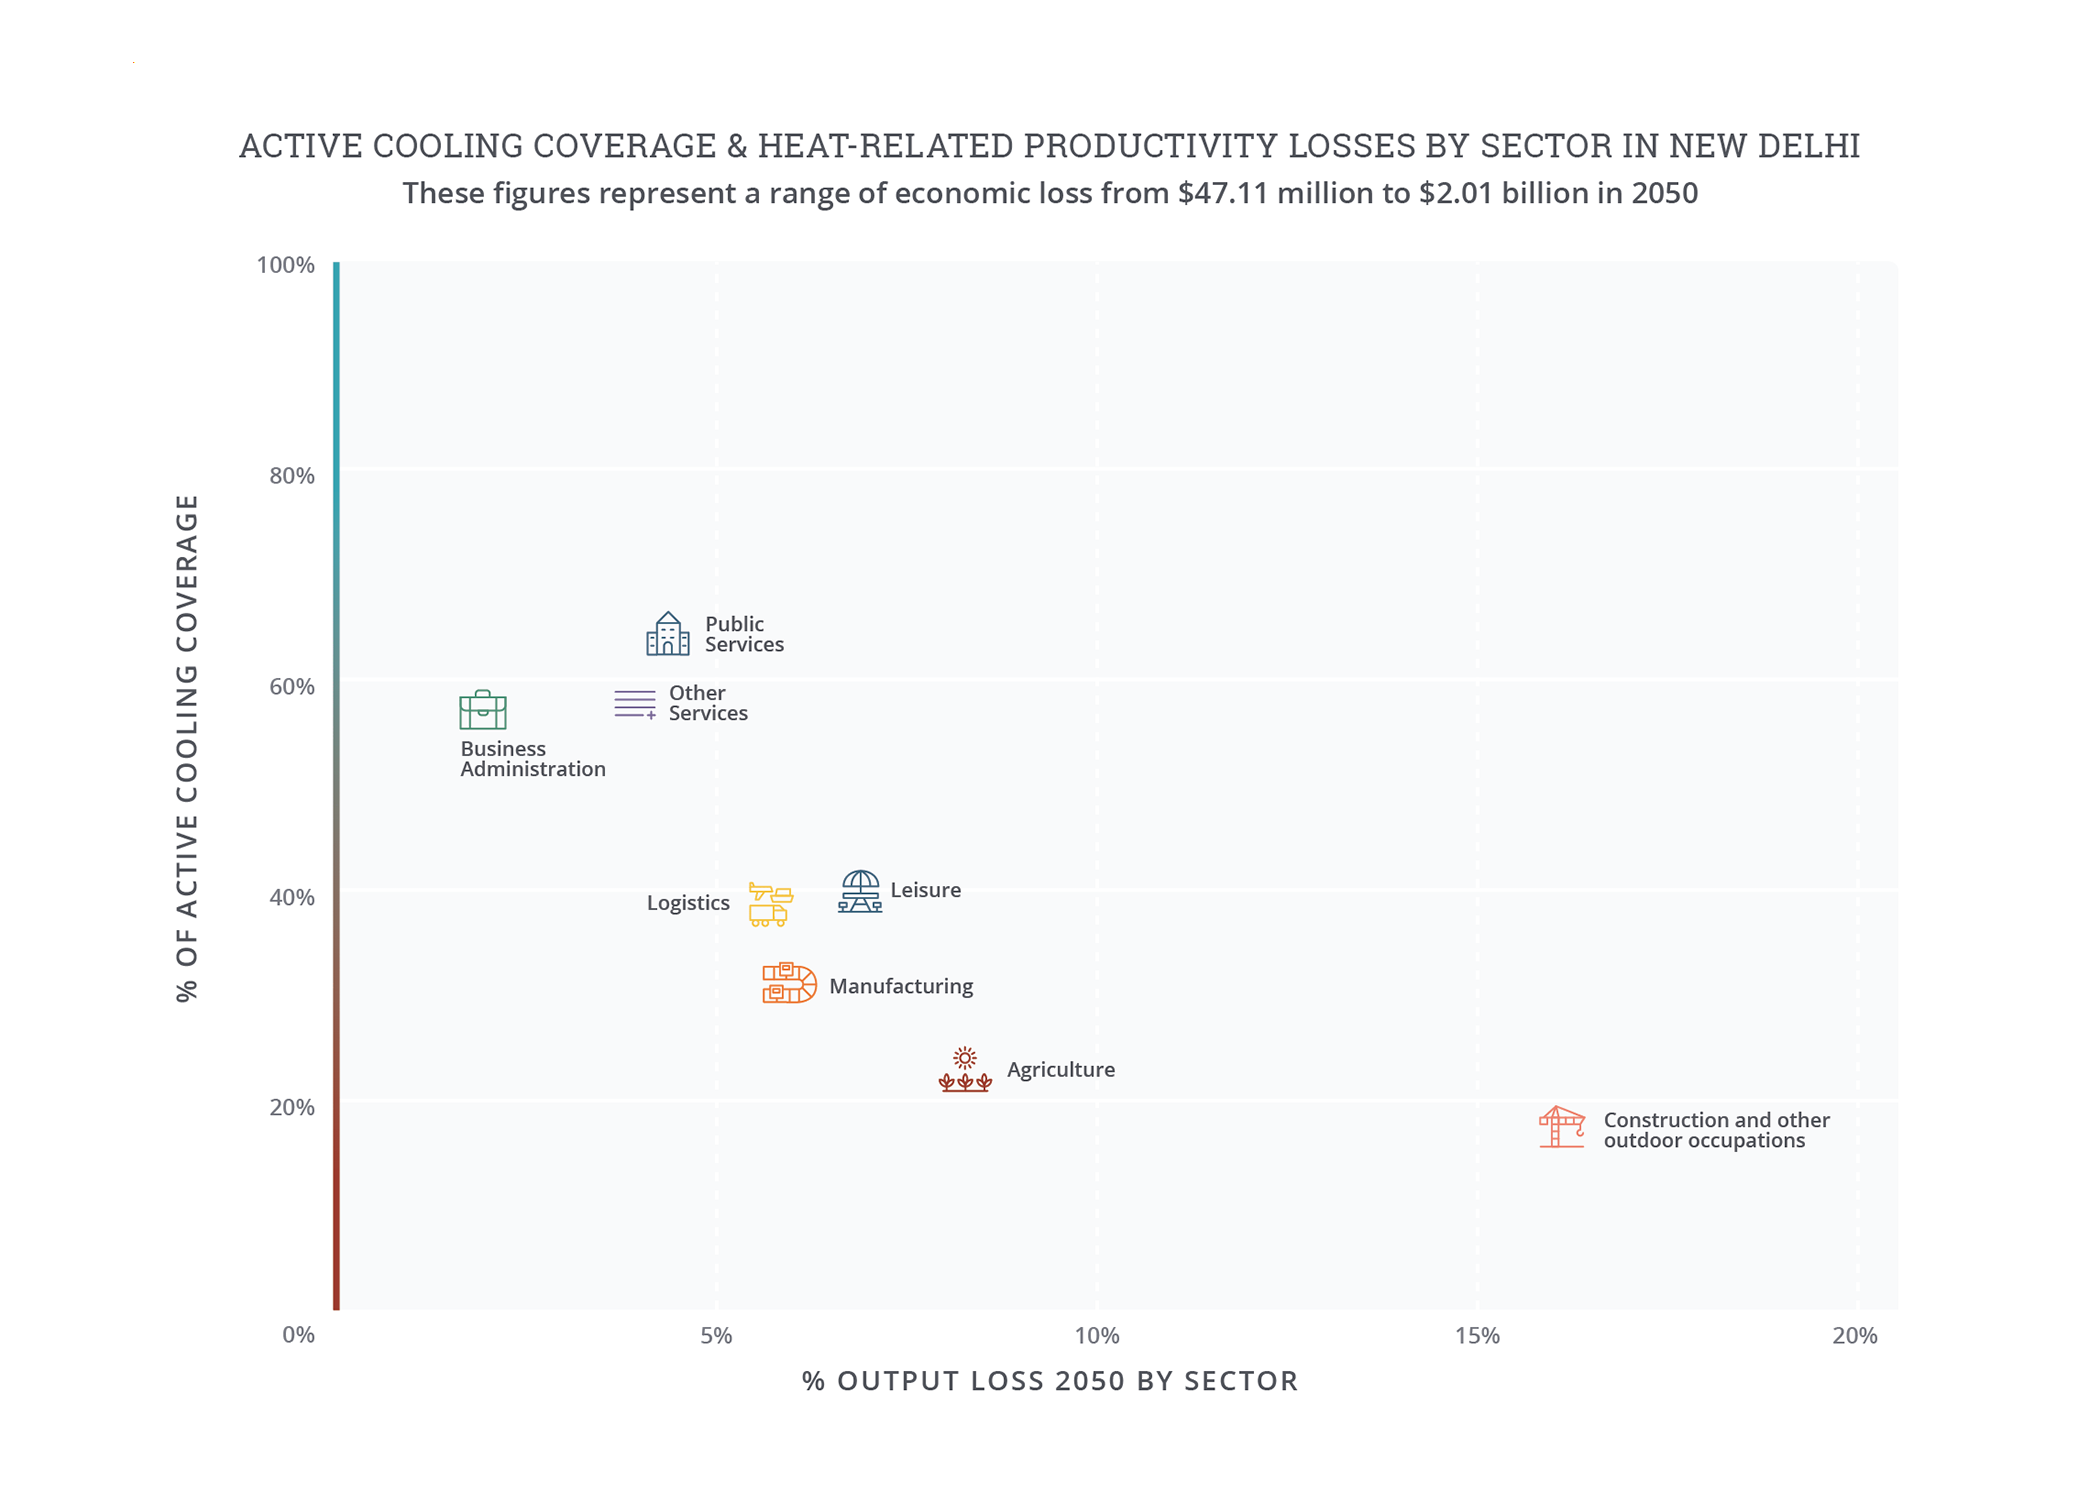
Construction workers bear the brunt of the heat: despite producing just 9 percent of New Delhi’s output, they account for one-third of the city’s losses, due to labor-intensive production and over 60 percent of working hours spent outdoors.
Impacts of heat on people in New Delhi are aggravated by air pollution, poverty, and unreliable access to essential services. Air pollution already causes 57,000 premature deaths per year, and heat contributes directly to concentrations of pollutants such as fine inhalable particles and ozone, while compounding physical stress on vulnerable people.
New Delhi is actively adapting to heat through urban planning and labor regulation, but efforts could be scaled given the magnitude of the challenge and include initiatives to manage adverse impacts from wider use of air-conditioning on the power grid and air pollution.
Extreme heat conditions
As the heat waves of 2022 illustrate, extreme heat is already a severe hazard in New Delhi,1 and it is set to become more intense and more frequent as climate change progresses.2 New Delhi already endures days where mean temperature (including overnight temperatures) reaches around 33.4°C or higher for 10 percent of the year (thirty-six days), and the hottest ten days in a typical year surpass average temperatures of 36.2°C. Without further action to reduce emissions, these numbers are set to increase. Hot days will become 33 percent more frequent (forty-eight days in a typical year) and the conditions experienced on the current hottest ten days are likely to occur seventeen days per year by 2050. More worryingly, extreme events such as this year’s intense heat wave are already estimated to be around thirty times more likely and 1°C hotter than in preindustrial conditions—and without rapid action, these could become up to twenty times more likely and 1.5°C warmer again.3
The effects of heat are unevenly distributed around New Delhi, with the highest temperatures experienced in the western sprawl of the city. In these built-up areas, temperatures can be as much as 8°C hotter than rural surroundings, and are projected to rise to 9°C by 2050.4 This urban heat island (UHI) effect is caused by sprawling developments and heat-intensifying paved surfaces trapping heat, cause relatively higher urban temperatures compared to surrounding rural areas. Without careful planning, New Delhi’s projected continued population growth of 20 percent by 2050 may drive further sprawling urban expansion,5 exacerbating the UHI problem.
Impact of heat
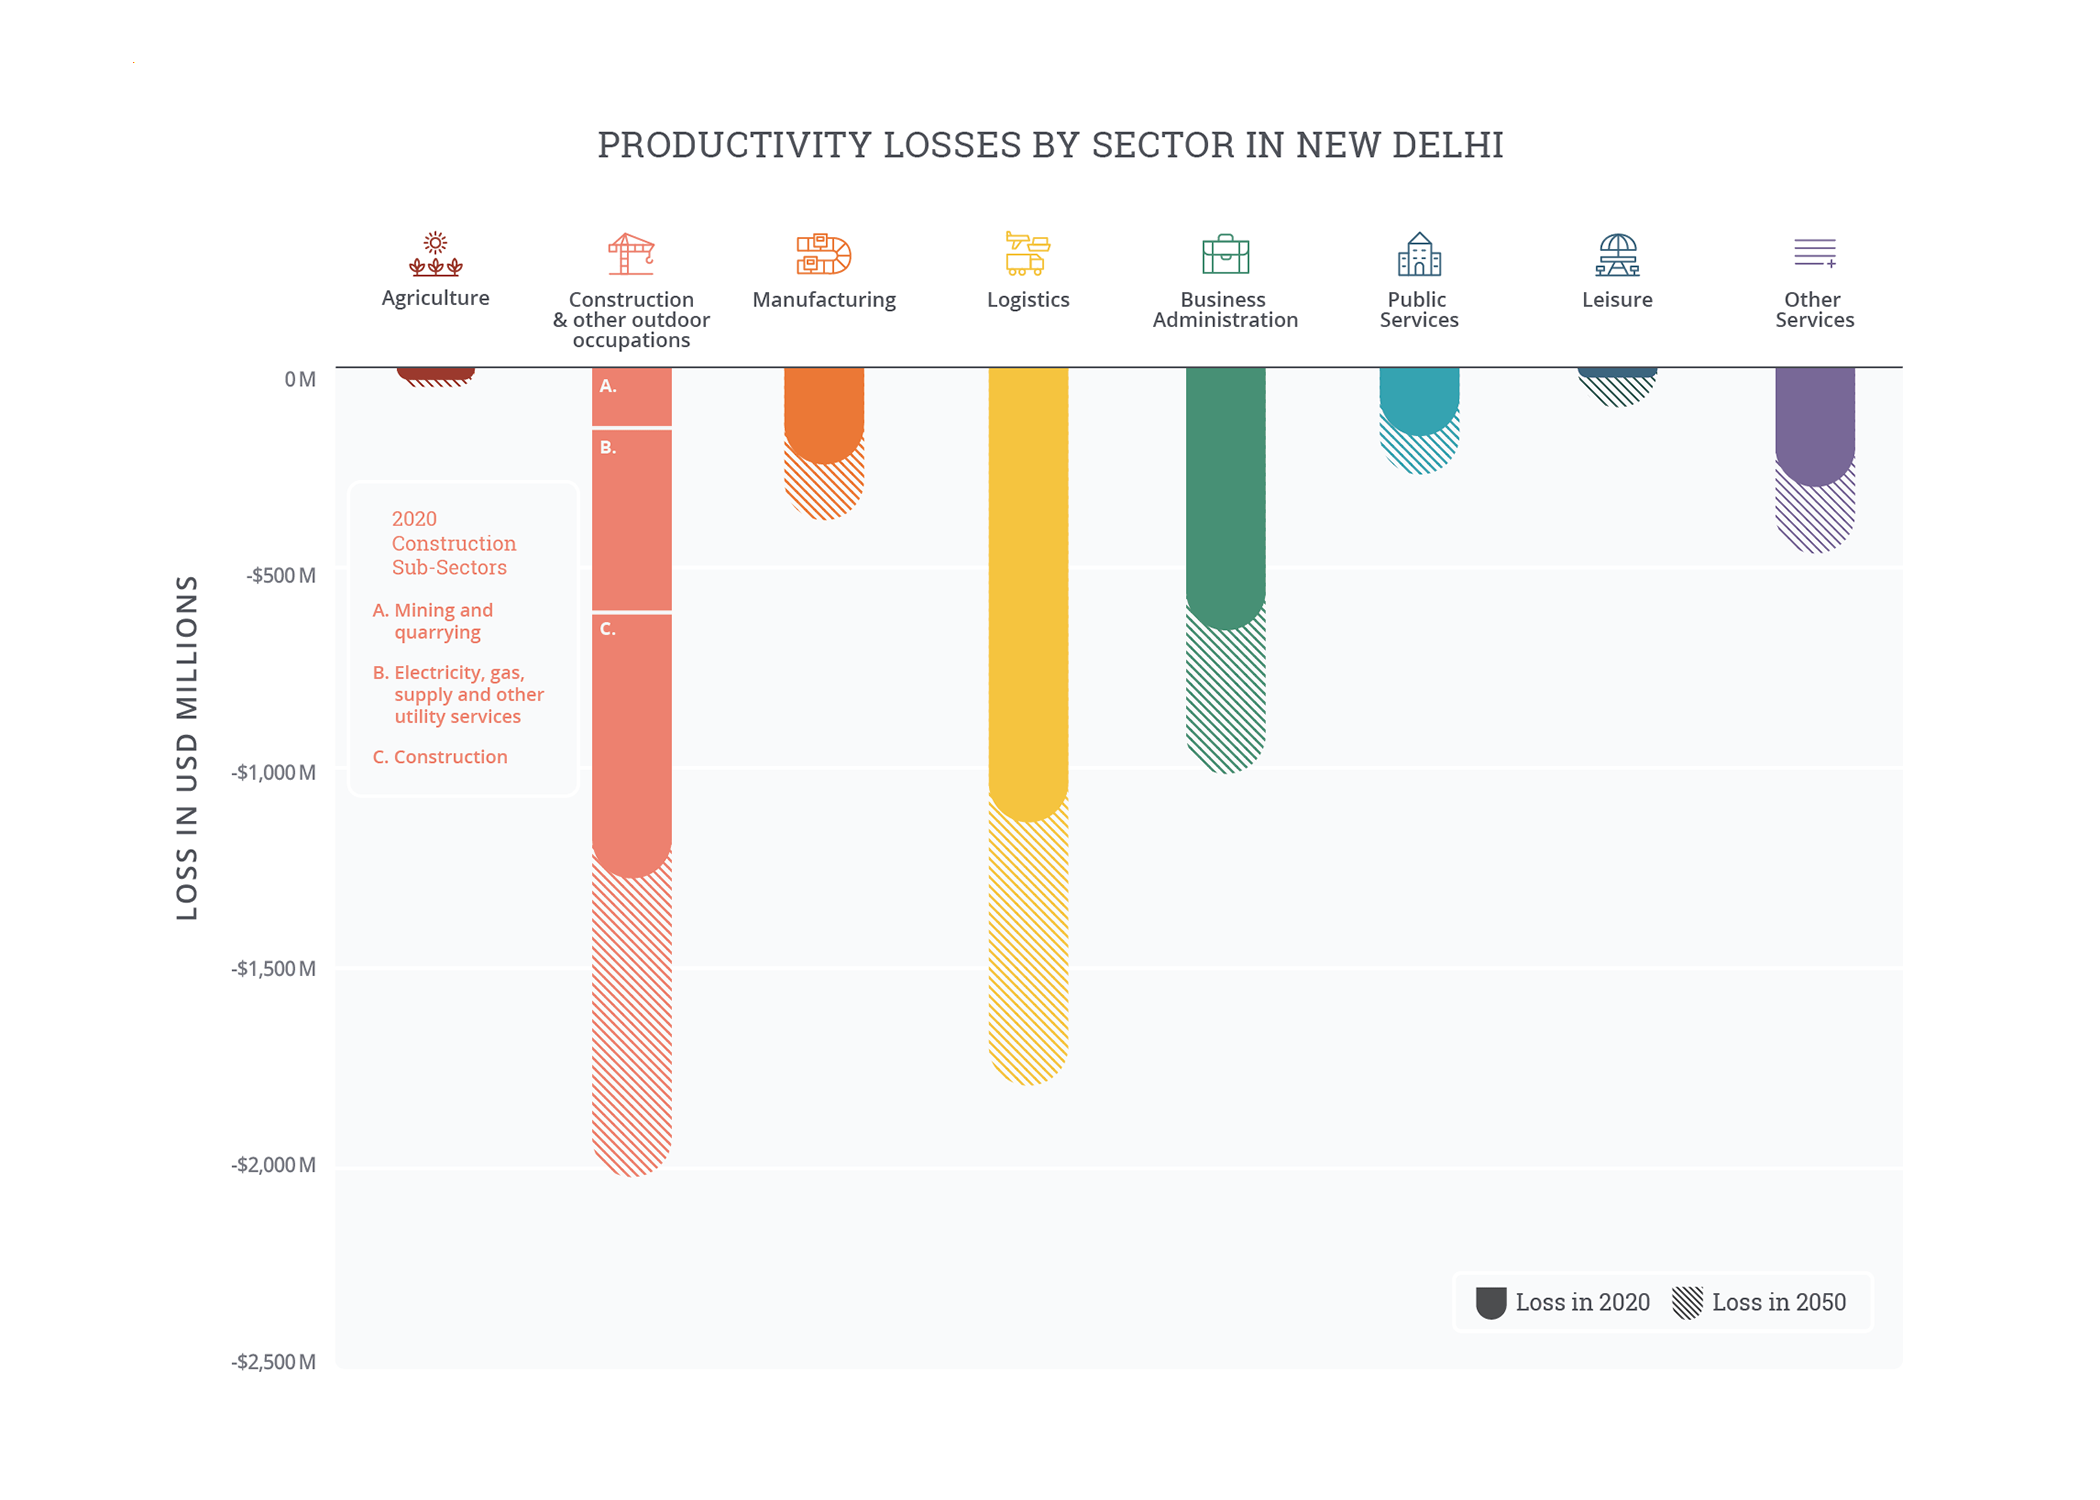
Extreme heat currently causes 4 percent of New Delhi’s total economic output6 to be lost due to reduced worker productivity, and this lost output may rise to 5 percent by 2050.7 Hot and humid conditions8 in New Delhi lead to average labor productivity losses of 20 percent for indoor or shaded workers, and 25 percent for those working under the heat of the sun. By 2050, without dramatic action to reduce emissions, these impacts could increase to losses of 24 percent and 30 percent, respectively. This translates into economic impacts of 4 percent of potential output, or USD 3.9 billion (USD 3.85 billion/INR 29,868 crore)9 in 2020. By 2050, labor productivity losses are projected to increase to USD 6.1 billion (USD 6.06 billion/INR 475,013 crore), equivalent to 5 percent of potential output. If the full economic impacts of heat were considered—for example, damage to infrastructure and machinery, increased healthcare costs, and the indirect impacts of reduced productivity on the broader economy—then the total losses could be substantially higher.
Construction workers bear the brunt of the heat: despite producing just 9 percent of New Delhi’s output, they account for one-third of the city’s lost output. Labor-intensive production and a high share (over 60 percent) of working hours spent outdoors are critical to driving these output losses, which currently amount to 13 percent of output in the sector. Logistics and business administration make up most of the rest of New Delhi’s lost output, at 30 percent and 17 percent, respectively, due to their larger relative contributions to the city’s economy.
The health impacts of heat in New Delhi are aggravated by air pollution and poverty. Health impacts are expected to be compounded by the effects of air pollution, infrastructure failures such as frequent power blackouts, and many households—particularly those in poverty—lacking adequate water supplies or access to shelter from the heat.


Note on “Projected number of hot and extremely hot days”: Days where the twenty-four hour average (i.e., daily) temperature exceeds the local 90th percentile of the baseline average daily temperature are defined as “hot days,” while days where the daily temperature exceeds the local 97.5th percentile are defined as “extreme hot days.” Because hot days are relative to typical local temperatures, the same daily temperature may be considered “hot” in one city but not another. The baseline is based on historical climate data, 1985-2005, while 2050 is based
on the 2040-2060 climate projection from an ensemble of CMIP6 models under RCP 7.0.
Note on “Productivity losses by sector”:9 The agricultural sector captures loss within the defined city limits and does not account for agricultural loss from the surrounding rural areas. Baseline losses are based on historical climate data from 1985-2005 and economic data from 2019. 2050 losses are based on the 2040-2060 climate projection from an ensemble of CMIP6 models under RCP 7.0 and economic models under SSP3. Losses assume no change in sectoral composition of economy. Source: Vivid Economics.
Note on “Active cooling coverage and heat related productivity losses by sector”: O*NET, 2021; and analysis by Vivid Economics.
Extreme heat interventions
New Delhi is actively adapting to heat through urban planning and behavioral changes. Efforts meant to tackle the rising temperatures across the city’s public and private spaces include:
- Planning/policy: To limit heat exposure, New Delhi and surrounding areas have changed working and schooling hours. These initiatives will see some classes ending by 11 a.m. and affected public-sector outdoor workers mandated to stop working by noon, allowing them respite from the hottest hours of the day.16
- Investment in the built environment and nature-based solutions: The draft Master Plan for Delhi to 2041 (MPD-2041) embeds heat resilience alongside other climate and development considerations, highlighting multiple win options such as introducing permeable paving to mitigate both flood and heat risks, investing in shared district cooling to reduce energy use and expand cooling access, and green solutions that reduce both heat and pollution.17 To reduce urban heat islands, New Delhi is increasing the number of trees in the city by more than 20 percent and introducing biocorridors to connect large green nodes and incorporate vegetation.18 Local leaders are also working with the national government on a program to incorporate “cool roofs” in buildings.19 Demand for AC and cooling has increased significantly in recent years and is expected to grow a further 40 percent by 2040.20 While this can reduce heat exposure in homes and workplaces, it can also exacerbate heat’s impact by placing the electrical grid under pressure and increasing pollution from power generation. The 2019 India Cooling Action Plan is conscious of these links and seeks to reduce energy demand from AC while mitigating the impacts of extreme heat. One of its key aims is to indicate sector-specific sustainable cooling technologies and provide government support to enable their expansion.21
Explore more city chapters
Return to the global summary
Endnotes
1 To estimate economic losses, this study goes beyond political boundaries to give a sense of how extreme heat and humidity impact New Delhi’s influence area. Core economic modeling considers Delhi District of India. The regional approach is to ensure that analysis covers populations that are central to New Delhi’s growth and urban trajectory.
2 To estimate economic losses, this study encompasses the entire National Capital Territory.
3 Lottie Butler and Siobhan Stack-Maddox, “Climate Change Made Devastating Early Heat in India and Pakistan 30 Times More Likely,” Imperial College London, May 26, 2022, https://www.imperial.ac.uk/news/236696/climate-change-made-deadly-heatwave-india.
4 Analysis by Vivid Economics, based on summer average land surface temperature (LST), modeled climate data in 2050, and analysis of expected UHI and urban development from Kangning Huang et al., “Projecting Global Urban Land Expansion and Heat Island Intensification through 2050,” Environmental Research Letters 14, no. 11, 2019.
5 Delhi Development Authority, Delhi Master Plan 2021, Draft for Reference, Modification through March 31, 2017, http://52.172.182.107/BPAMSClient/seConfigFiles/Downloads/MPD2021.pdf.
6 Economic data in this report are from 2019 to avoid capturing the effect of COVID-19 on the economies of the cities analyzed; see methodology for further details.
7 All analysis is based on RCP 7.0 and SSP3 using an ensemble mean of CMIP6 models; see accompanying methodology document for details.
8 The analysis uses wet bulb globe temperature (WBGT) as a measure of perceived temperature to capture the effects of weather on human health and productivity.
9 Numbers are approximate and rounded to the nearest 10. Exchange rates from International Monetary Fund (2022). 2021 annual average exchange rate – 77.58 INR/USD. Available at https://data.imf.org/regular.aspx?key=61545850. A crore denotes ten million Indian Rupees (INR).
10 Air Quality Life Index, AQLI India Fact Sheet, Energy Policy Institute, University of Chicago, 2022, https://aqli.epic.uchicago.edu/country-spotlight/india/.
11 New York Times, “Who Gets to Breathe Clean Air in New Delhi?,” December 17, 2020, https://www.nytimes.com/interactive/2020/12/17/world/asia/india-pollution-inequality.html.
12 Particles with diameters that are generally 2.5 micrometers and smaller(PM2.5) are fine inhalable particles, according to the US Environmental Protection Agency.
13 Assuming constant dosage effects, an average 3-day hot spell in Delhi in 2050 will be associated with 141 micrograms per cubic meter of surface ozone and between 50 to 250 micrograms per cubic meter of PM 2.5, compared to guidelines of 10 micrograms/cubic meter. Calculated based on results from: India State-Level Disease Burden Initiative Air Pollution Collaborators (2020). Health and economic impact of air pollution in the states of India: the Global Burden of Disease Study 2019. The Lancet, Volume 5, Issue 1, E25-E38, January 01, 2021. Available at: https://www.thelancet.com/journals/lanplh/article/PIIS2542-5196(20)30298-9/fulltext#%20
14 I. Jhun at al., “Effect Modification of Ozone-related Mortality Risks by Temperature in 97 US Cities,” Environment International 73 (2014): 128-134, https://doi.org/10.1016/j.envint.2014.07.009; M. Staffogia et al., “Does Temperature Modify the Association between Air Pollution and Mortality? A Multicity Case-Crossover Analysis in Italy,” American Journal of Epidemiology 167, no. 12 (2008): 1476-1485, https://doi.org/10.1093/aje/kwn074; and M. Scortichini et al., “Short-Term Effects of Heat on Mortality and Effect Modification by Air Pollution in 25 Italian Cities,” International Journal of Environmental Research and Public Health 15, no. 8 (2018), 1771, https://doi.org/10.3390/ijerph15081771.
15 P. Kumar et al., “The Nexus between Air Pollution, Green Infrastructure and Human Health,” Environment International 133 (2019): 105181, https://doi.org/10.1016/j.envint.2019.105181.
16 New Delhi Television, “Heatwave: Revise School Timings or Advance Summer Holidays, Demand Parents In Delhi,” May 3, 2022, https://www.ndtv.com/education/heatwave-revise-school-timings-or-advance-summer-holidays-demand-parents-in-delhi.
17 Delhi Development Authority, Draft Master Plan for Delhi-2041, 2021, ;
18 “Due to Tree Transplantation Policy Delhi’s Green Cover Didn’t Dip Despite Devp Projects: Kejriwal,” ThePrint (platform), June 10, 2022, https://theprint.in/india/due-to-tree-transplantation-policy-delhis-green-cover-didnt-dip-despite-devp-projects-kejriwal/991150/.
19 “Cool Roofs to Conserve Energy,” Hindu, January 19, 2011, https://www.thehindu.com/news/cities/Delhi/Cool-roofs-to-conserve-energy/article15524676.ece.
20 “Air-conditioners in Delhi Homes Drive Up Power Demand: CSE,” Hindu BusinessLine, June 12, 2021, https://www.thehindubusinessline.com/news/national/air-conditioners-in-delhi-homes-drive-up-power-demand-cse/article24143683.ece.
21 India Cooling Action Plan, Ozone Cell, Ministry of Environment, Forest, and Climate Change, Government of India, 2019, http://ozonecell.nic.in/wp-content/uploads/2019/03/INDIA-COOLING-ACTION-PLAN-e-circulation-version080319.pdf.
