Overview
Santiago’s climate is mild but dry for most of the year, leaving its residents unprepared and exposed when heat waves strike. In 2016, the city experienced its highest ever recorded temperature, 37.3°C, during a period of extreme drought when access to water required for cooling was rationed.
In a typical year, the economic costs associated with heat- and humidity-related worker productivity losses amount to over USD 100 million (USD 100.5 million/CLP 83,058 million)—enough to fund the construction of one of Santiago’s new metro line extensions. By 2050, losses may exceed USD 200 million (USD 226.3 million/CLP 187,025 million) per year.
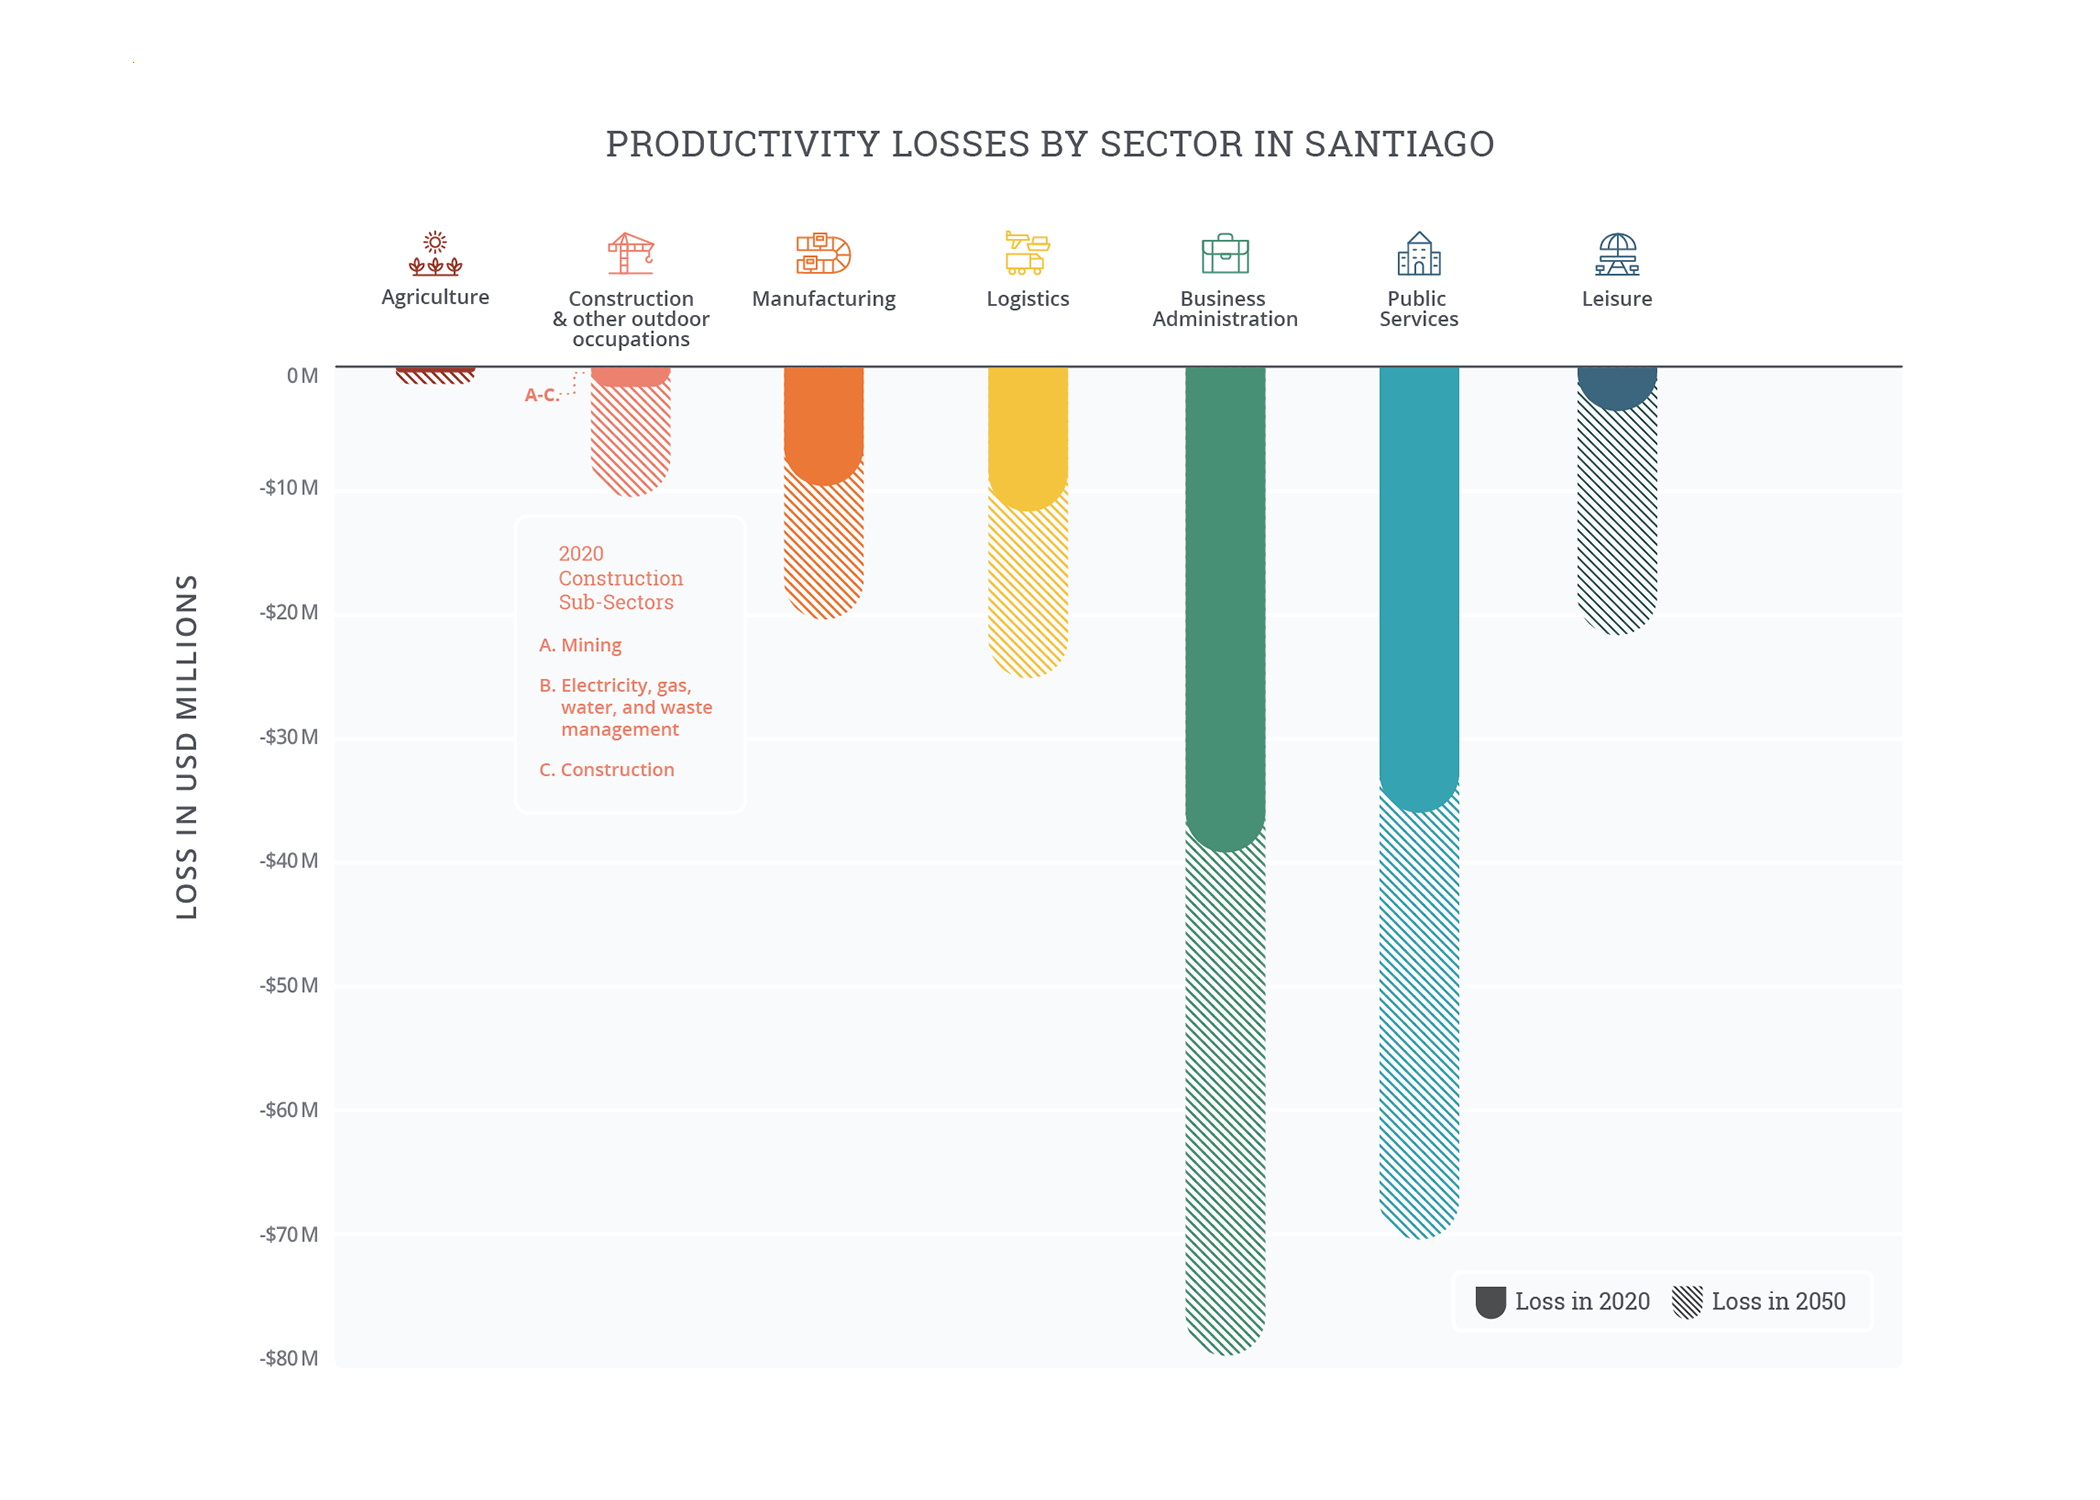
Current losses fall disproportionately in administration and public services, but the changing profile of heat exposure means future losses are concentrated in outdoor-intensive and active indoor occupations such as construction or utilities.
Santiago is just beginning its journey to heat resilience under the direction of its new Chief Heat Officer. Interventions can reflect the seasonality of the climate to prevent increasing winter heating costs, and policy action can target the most vulnerable to ensure they have access to cooling mechanisms, particularly when heat waves and droughts coincide.
Extreme heat conditions
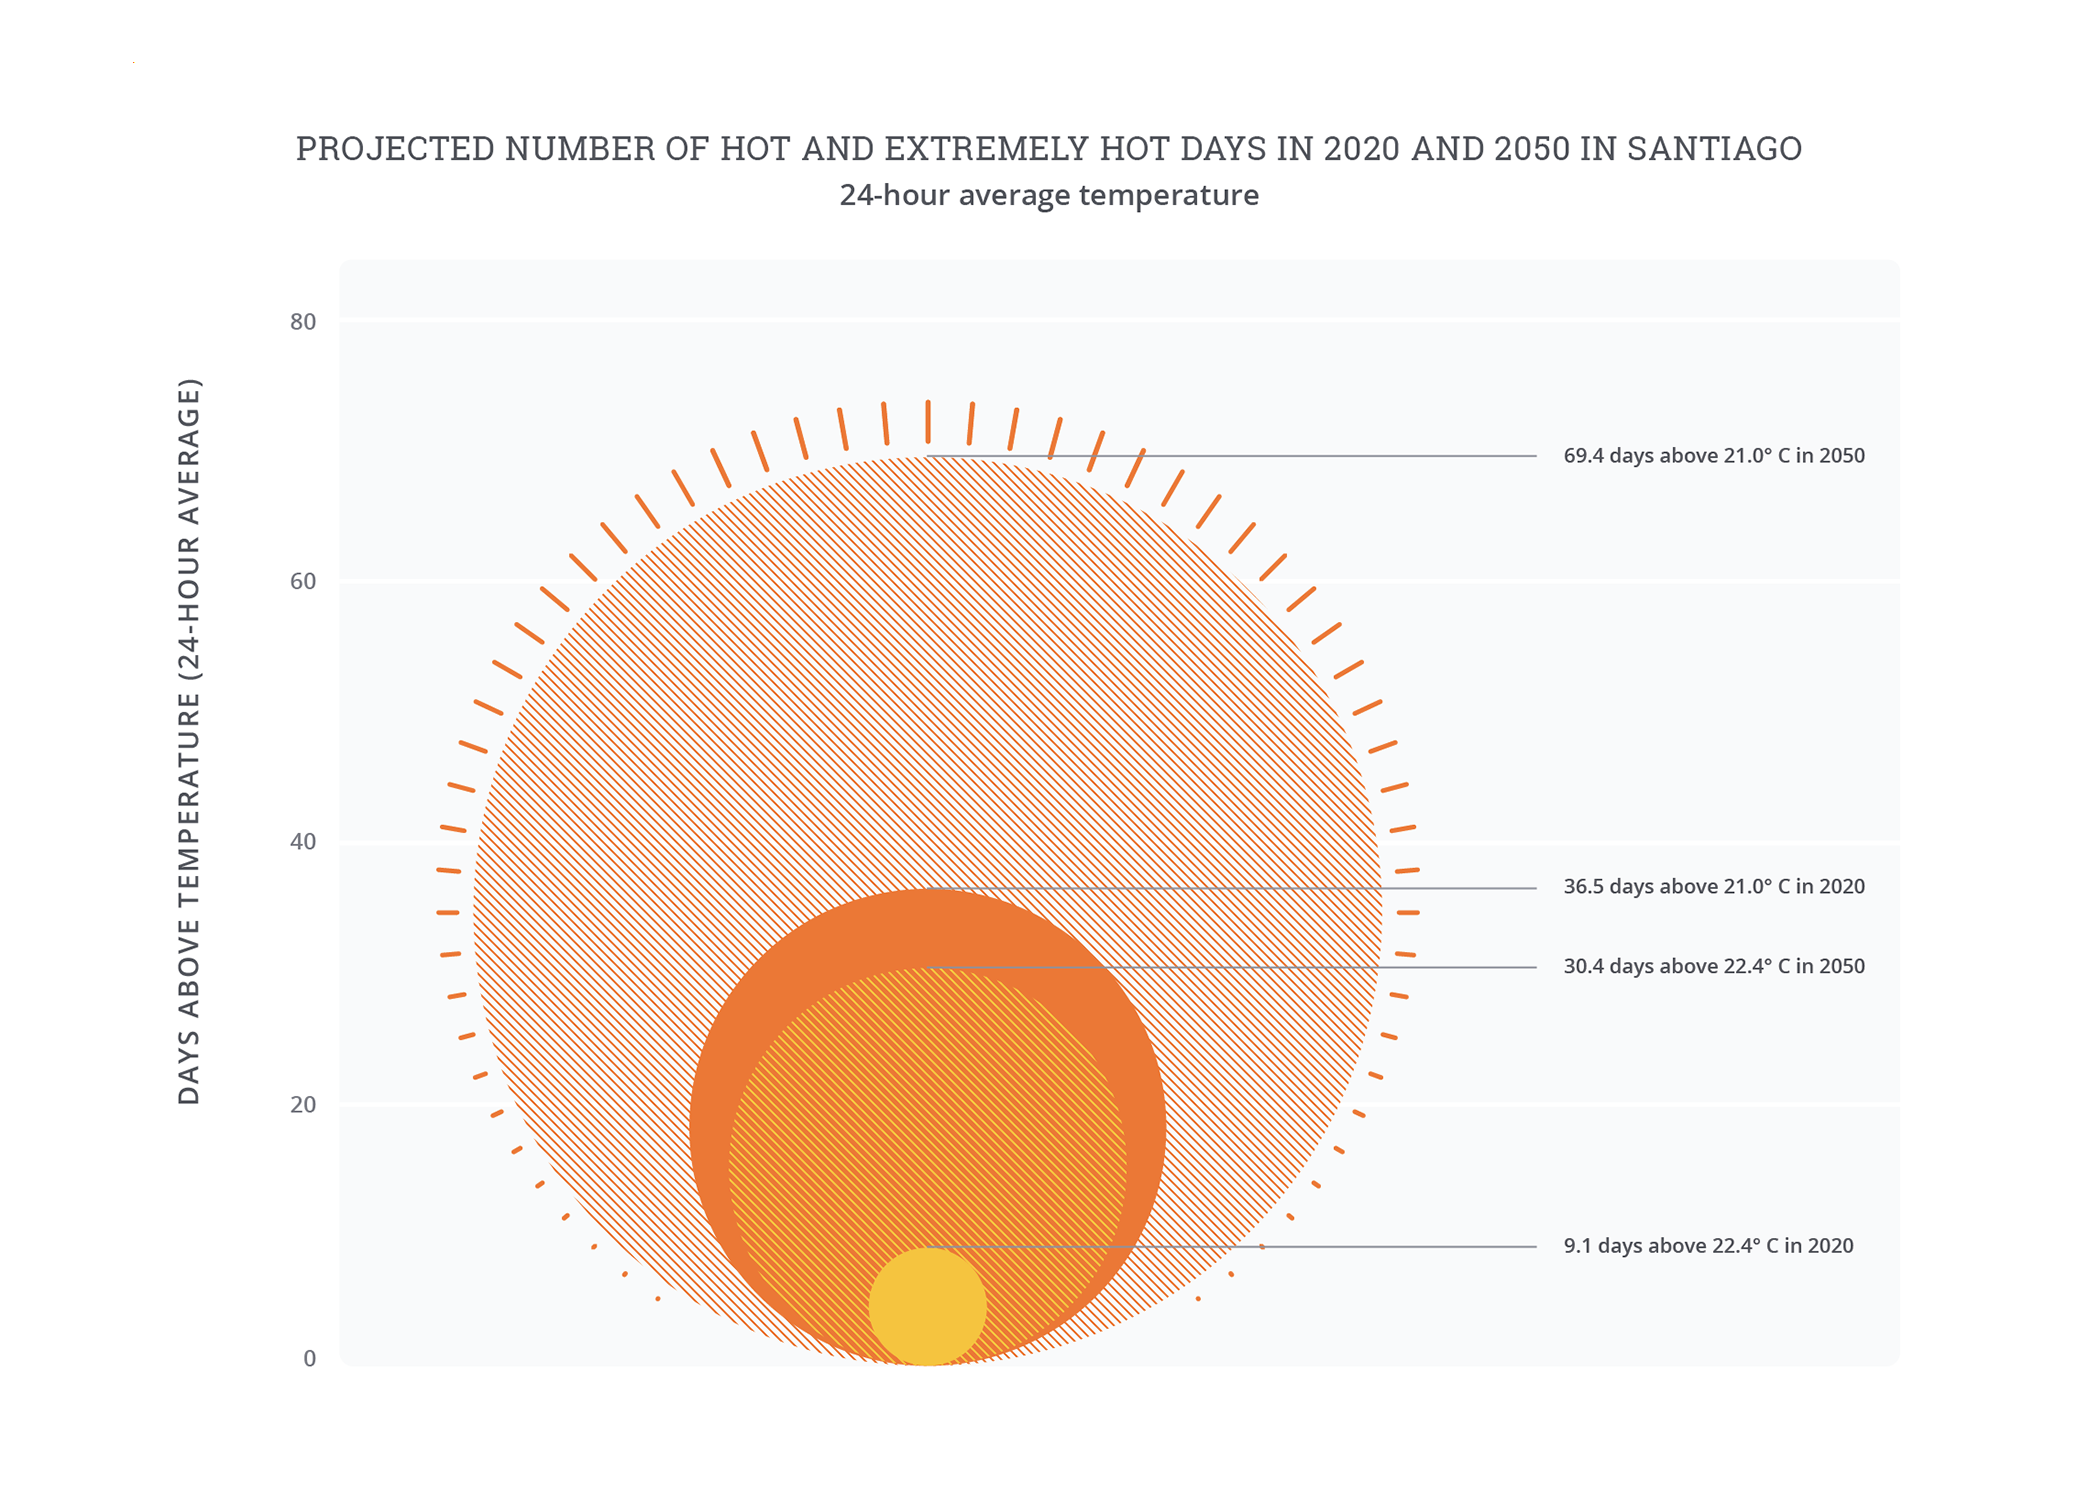
Santiago’s1 climate is mild but dry for most of the year, leaving its residents unprepared and exposed when heat waves strike. In Santiago, the ten hottest days in a typical year currently have average temperatures above 22°C,2 but temperatures have begun to reach new extremes in increasingly frequent heat waves. 2016 saw a record-breaking temperature of 37.3°C, topping the previous high of 37.2°C, which was recorded in 1915.3 The extreme heat exacerbates problems with regional water shortages: Chile has been in drought conditions for the past thirteen years, leading Santiago to ration water supplies.4 By 2050, the ten hottest days currently experienced will become more than three times as common. Based on these rising temperatures alone, heat-related deaths may double.5 The health and mortality effects may be even larger if drought severity or frequency persists and limits access to water during dangerous heat waves.
Impact of extreme heat
In a typical year, the economic costs associated with heat- and humidity-related worker productivity losses6 exceed USD 100 million7 (USD 100.5 million/CLP 83,058 million)8—enough to fund the construction of one of Santiago’s new metro line extensions.9 This estimate excludes rare events like recent record-breaking heat waves and considers only temperatures in a typical year. It also captures only the direct effects of workers exposed to heat, and does not reflect the broader economic impacts as lower incomes lead to lower spending and reduced demand even in sectors with more climate-controlled working conditions. Without action to reduce emissions or adapt to increasing heat, Santiago’s expected growth and the effects of climate change may cause losses to double to over USD 200 million (USD 226.3 million/CLP 187,025 million) each year by 2050.
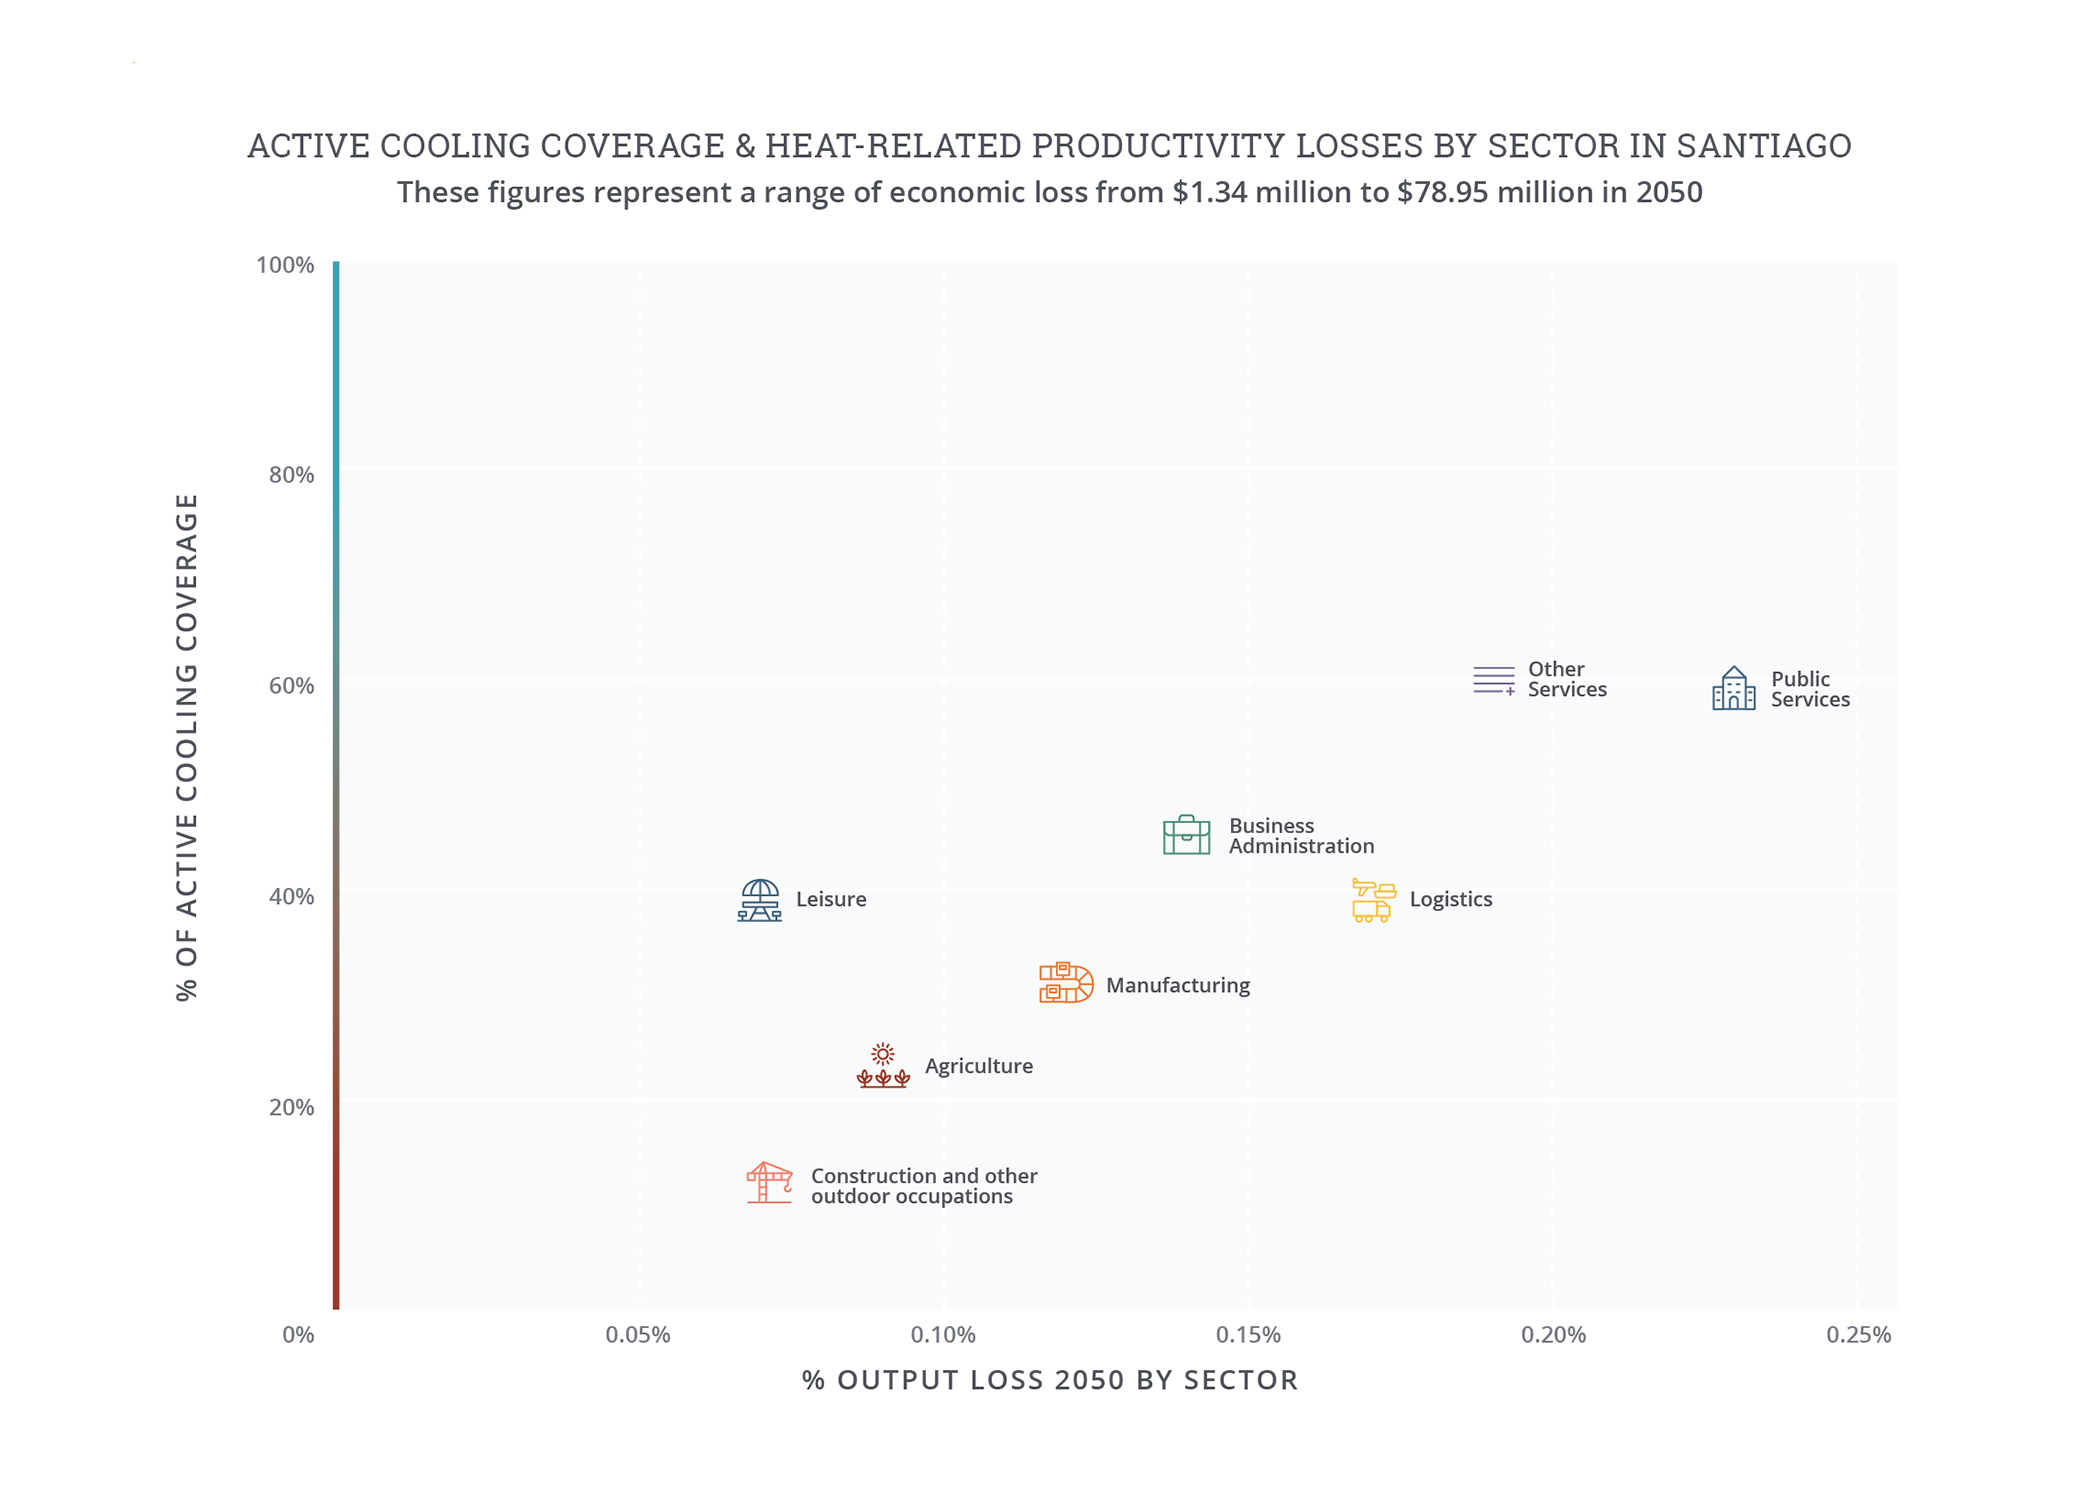
Business administration and public services currently account for half of Santiago’s total economic output and 75 percent of its heat-related labor productivity losses, but future losses could be driven more by outdoor intensive and active indoor occupations. These current high losses reflect the sensitivity of service economy workers to moderate levels of heat in indoor workplaces without air-conditioning. Many of the jobs in this sector are jobs predominantly held by women, such as teachers, nurses, and salon workers.10 However, the largest relative increases in output losses by 2050 will come in more outdoor-intensive occupations, such as construction, utilities, and mining and active indoor occupations such as leisure. Currently these sectors contribute only 5 percent of the total output lost due to heat- and humidity-related productivity reductions, for a value of around USD 5 million (CLP 4,132 million). By 2050, exposure to the higher temperatures that drive significant losses in physically intensive work may triple that share, and total losses across these sectors could exceed USD 30 million (CLP 24,793 million).


Note on “Projected number of hot and extremely hot days”: Days where the twenty-four hour average (i.e., daily) temperature exceeds the local 90th percentile of the baseline average daily temperature are defined as “hot days,” while days where the daily temperature exceeds the local 97.5th percentile are defined as “extreme hot days.” Because hot days are relative to typical local temperatures, the same daily temperature may be considered “hot” in one city but not another. The baseline is based on historical climate data, 1985-2005, while 2050 is based on the 2040-2060 climate projection from an ensemble of CMIP6 models under RCP 7.0.
Note on “Productivity losses by sector”: The agricultural sector captures loss within the defined city limits and does not account for agricultural loss from the surrounding rural areas. Baseline losses are based on historical climate data from 1985-2005 and economic data from 2019. 2050 losses are based on the 2040-2060 climate projection from an ensemble of CMIP6 models under RCP 7.0 and economic models under SSP3. Losses assume no change in sectoral composition of economy. Source: Vivid Economics.
Note on “Active cooling coverage and heat related productivity losses by sector”: O*NET, 2021; and analysis by Vivid Economics.
Extreme heat interventions
The increasing frequency and severity of heat waves has put extreme heat on the policy radar, and Santiago is beginning to take serious steps to promote resilience under a newly appointed Chief Heat Officer. Initiatives include:
- Policy/planning: Santiago has launched a protocol for a tiered warning system that could result in water rationing when necessary. The city is also designing its first official Regional Climate Action Plan, which will include a chapter focused on extreme heat.
- Investment in the built environment and nature-based solutions: The city is piloting green roofs, starting with 1,000 square meters of green roof on top of the Hospital Dr. Exequiel Fernandez Cortes. Other planned initiatives include increasing tree canopy coverage, providing shade to reduce urban heat intensification, and identifying ways to reduce heat-induced water stress in Santiago.
Explore more city chapters
Return to the global summary
Endnotes
1 To estimate economic losses, this study goes beyond political boundaries to give a sense of how extreme heat and humidity impact Santiago’s influence area. Core economic modeling considers the Santiago Metropolitan Region. The regional approach is to ensure that analysis covers populations that are central to Santiago’s growth and urban trajectory.
2 All analysis is based on RCP 7.0 and SSP3 using an ensemble mean of CMIP6 models; see accompanying methodology document for details.
3 Reuters staff, “Chilean Heat Wave Breaks Record Temperature Set a Century Ago,” Reuters, December 14, 2016, https://www.reuters.com/article/us-chile-weather-heat-wave-idUSKBN1432UR.
4 “Chile Announces Unprecedented Plan to Ration Water as Drought Enters 13th Year,” Guardian, April 11, 2022, https://www.theguardian.com/environment/2022/apr/11/santiago-chile-ration-water-drought.
5 Analysis by Vivid Economics, based on heat-mortality vulnerability functions from the C40 Cities benefits tool; see “Resilient Cities: Measuring Benefits of Urban Heat Adaptation,” C40 Cities, 2021, https://www.c40knowledgehub.org/s/article/Heat-Resilient-Cities-Measuring-benefits-of-urban-heat-adaptation?language=en_US.
6 The analysis uses wet bulb globe temperature (WBGT) as a measure of perceived temperature to capture the effects of weather on human health and productivity.
7 The economic data in this report are from 2019 to avoid capturing the effect of COVID-19 on the economies of the cities analyzed; see methodology for further details.
8 Numbers are approximate and rounded to the nearest 10. Exchange rates from International Monetary Fund (2022). 2021 annual average exchange rate – 826 CLP/USD. Available at https://data.imf.org/regular.aspx?key=61545850.
9 “Santiago Metro–Growth to 2030 Overview,” Ax Legal (website), accessed September 2022, https://ax.legal/2022/02/23/3434/.
10 The workability analysis is based on climate factors and not indoor working conditions determined by built environment characteristics or workplace layout (e.g., equipment that generates heat, body heat in close spaces, ventilation or greenhouse effects from windows, external shading); in practice, some of these factors can make indoor environments hotter than the modeled climate conditions suggest. See Gender Equality in Chile: Towards a Better Sharing of Paid and Unpaid Work, Organisation for Economic Co-operation and Development (OECD), 2021, https://www.oecd-ilibrary.org/sites/6cc8ea3e-en/1/3/1/index.html?itemId=/content/publication/6cc8ea3e-en&_csp_=ea9b389d9a3fef64664f0e136e83873a&itemIGO=oecd&itemContentType=book#section-d1e162; and Meredith Wood, “How Pink Collar Jobs Have Changed Since 1940,” International Women in Mining (IWiM), 2020, https://internationalwim.org/how-pink-collar-jobs-have-changed-since-1940/.
11 Maureen Trebilcock et al., “Thermal Comfort in Primary Schools: A Field Study in Chile” (Conference paper, 8th Windsor Conference: Counting the Cost of Comfort in a Changing World, Windsor, United Kingdom, April 2014), https://www.researchgate.net/publication/278038413_Thermal_comfort_in_primary_schools_a_field_study_in_Chile.
12 “Chile: Working Conditions of School Teachers,” OECD, 2014, https://www.oecd-ilibrary.org/sites/27fc15ff-en/index.html?itemId=/content/component/27fc15ff-en#section-d12020e2787.
13 Maureen Trebilcock et al., “A Parametric Analysis of Simple Passive Strategies for Improving Thermal Performance of School Classrooms in Chile,” Architectural Science Review 59, no. 5 (2016): 385-399, https://www.tandfonline.com/doi/abs/10.1080/00038628.2016.1150251.
14 J. Goodman et al., Heat and Learning, Harvard Kennedy School Faculty Research Working Paper Series RWP18-014, May 2018, https://www.hks.harvard.edu/publications/heat-and-learning.
